From afterthought to strategic advantage: How I rebuilt a struggling design team, increased productivity, drove MaaS initiatives, and accelerated time-to-market across 6,000 cities in 80 countries.
45%
increased productivity
25%
accelerated time-to-market
Transforming UX Maturity at Flowbird: From Production Team to Strategic Partner
Overview
When I joined Flowbird as Head of Design in 2022, I inherited a UX team treated as a production service rather than a strategic partner. Over nearly three years, I transformed this struggling function into a high-performing design organization that accelerated time-to-market by 25%, increased team productivity by 45%, and maintained 95% retention through a complex international merger.
Chapters


Role:
Head of Design

Timeline:
2022-2025 (2.7 years)

Team:
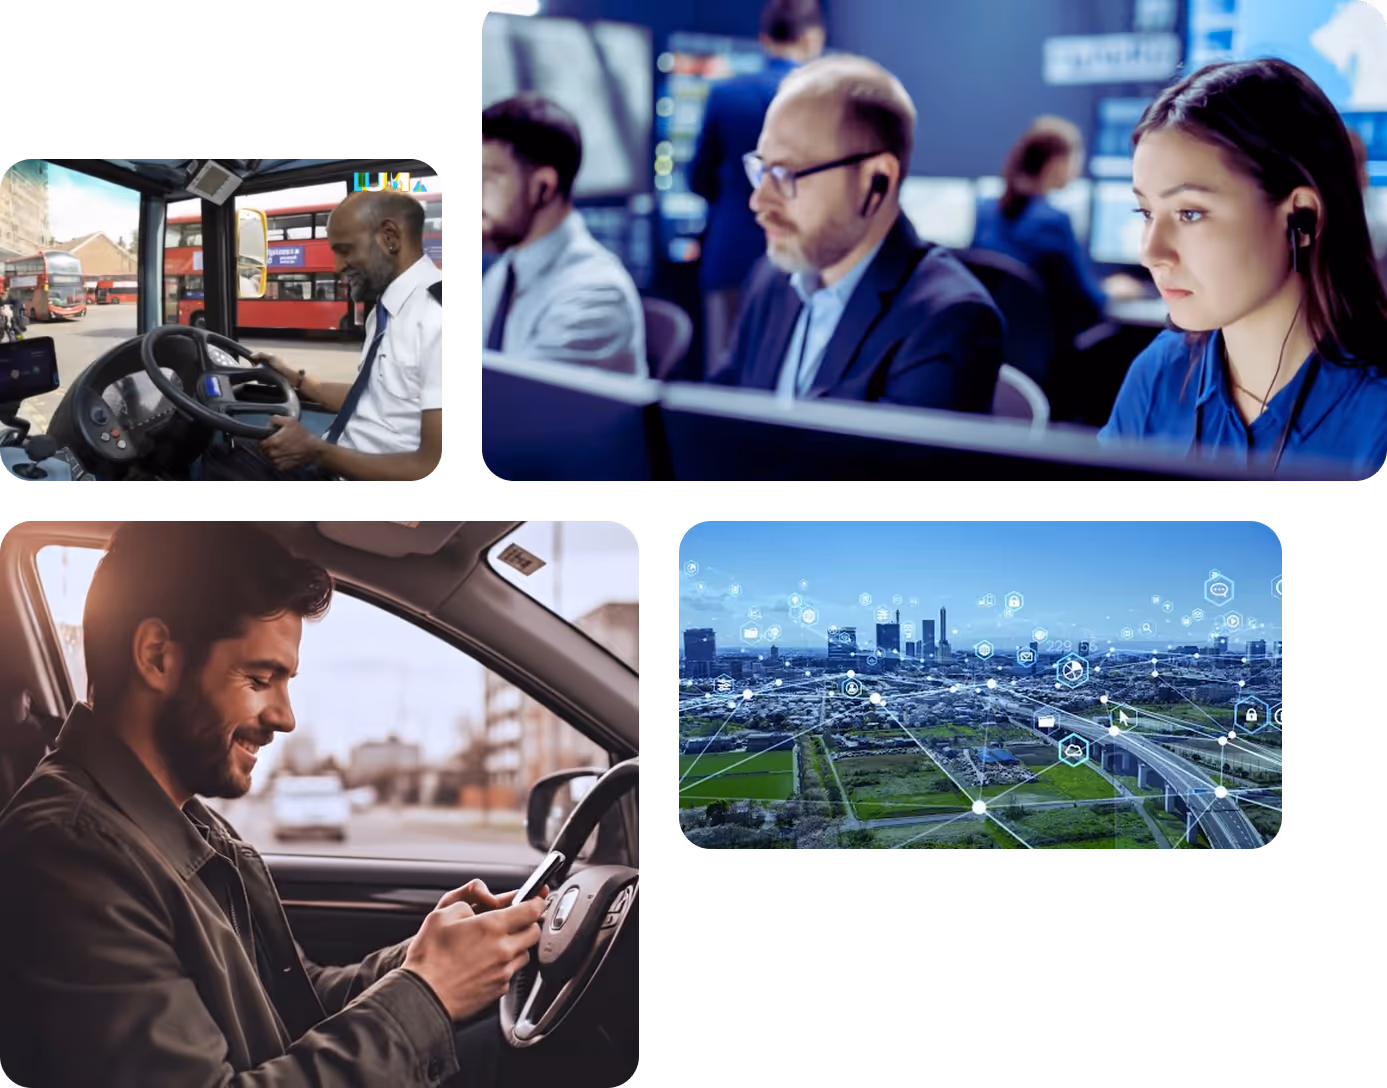
Led 8 designers across France, Poland, Switzerland, India, UK, and USA

Collaborators:
Reported to COO and CPO, partnered with product managers, business strategists, and developers across 5 platform verticals

Scope:
On/off-street parking apps, SaaS Hub dashboards, parking terminals, public transport terminals

Company Context:
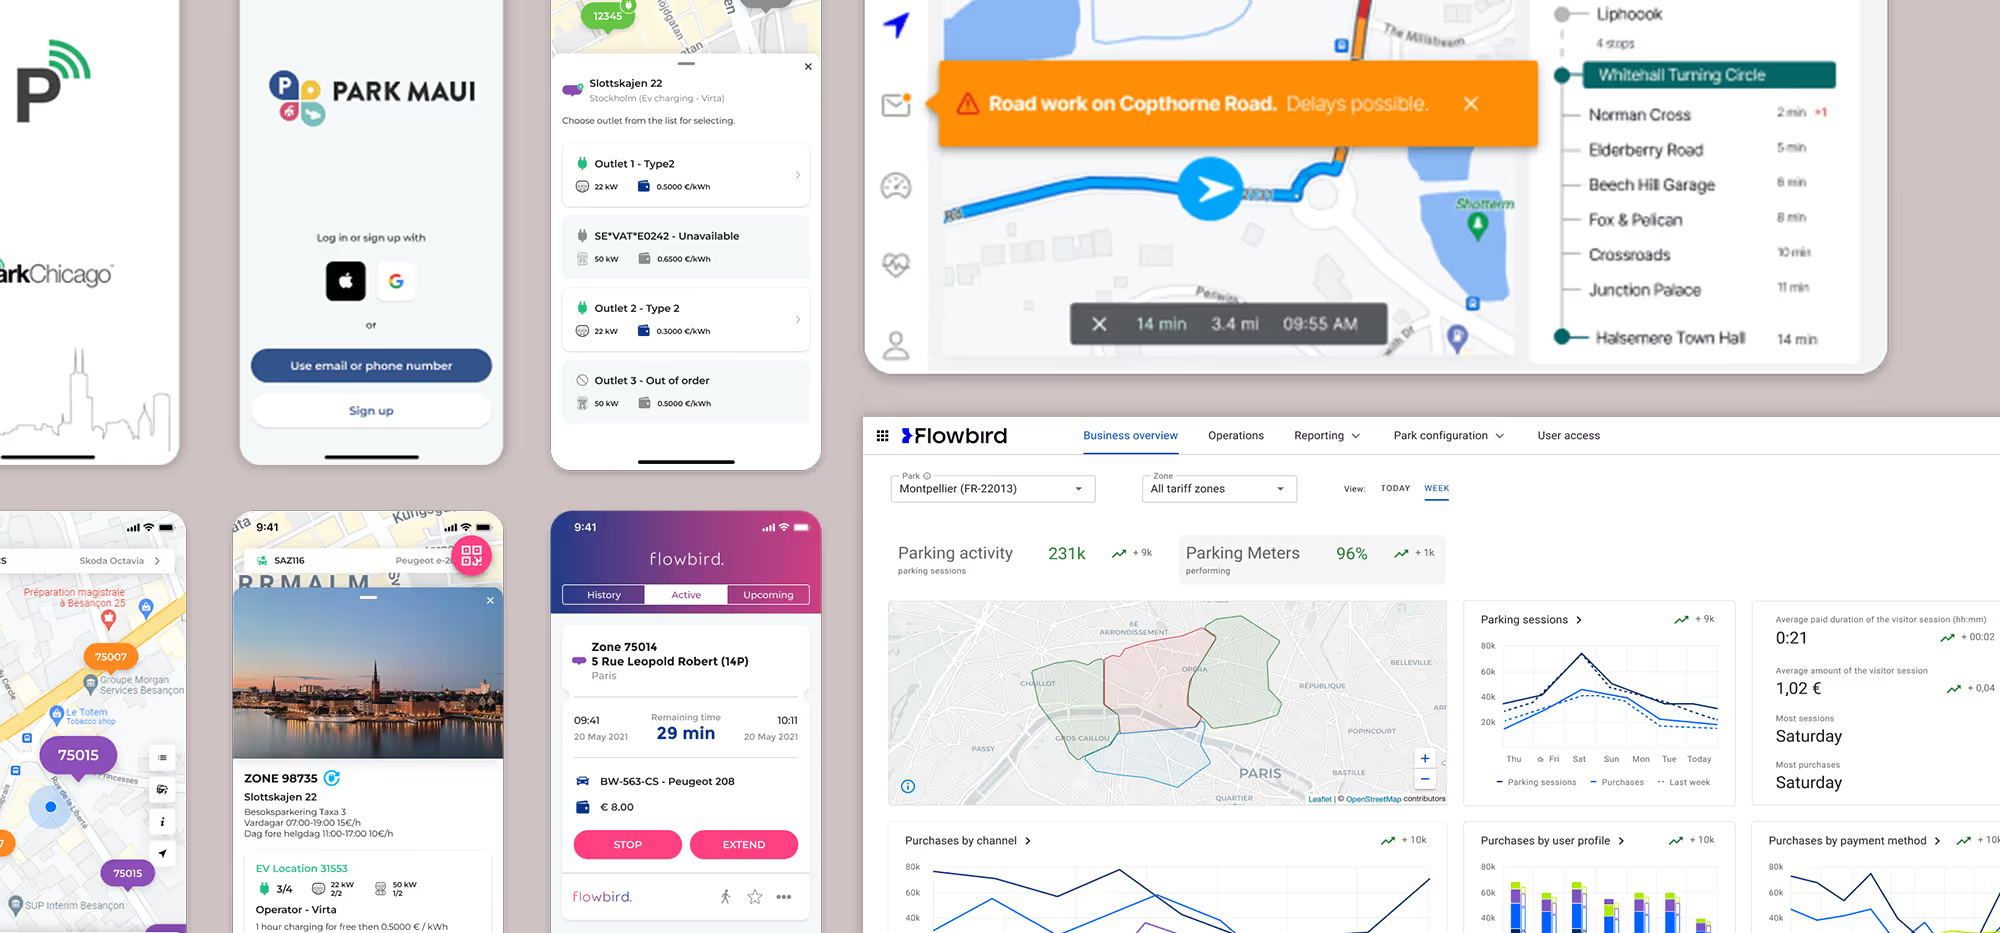
Flowbird is a global MaaS (Mobility as a Service) company specializing in urban mobility payment and ticketing systems for parking and public transport, servicing 6,000+ cities in 80+ countries through IoT infrastructure including parking sensors, EV charging stations, payment terminals, and transit systems.
The Challenge: A Struggling UX Team

1. The Team:
The UX function operated as a production arm rather than a strategic partner—no team alignment, no rituals, no mentoring, and uneven talent. Belarus-based designers were being dismissed due to EU sanctions with no succession plan in place, and UX had no advocate at the leadership level.

2. The Operations:
There was no operational planning or backlog; work was entirely reactive. Product owners requested design ad-hoc, often driven by sales rather than user needs. No research or testing practices existed, and Figma files had no standards. Collaboration was minimal, and design handoff was a black box with no review or measurement.

3. The Design Quality:
The SaaS Hub dashboard had no clear vision and was barely usable, offering little value. Figma files were disorganized and undocumented, mixing mobile, SaaS, and terminal work. Design quality varied widely across products, with no design system or functional component library in place.
The Business Impact:
Low UX maturity led to poor user understanding, slow delivery, and negative feedback reaching sales. Stakeholders wanted to improve the end-to-end product process, bring users into design decisions, and raise design quality.
Setting the Stage
Impact At-a-Glance
Team Transformation
- Employee retention: ~50% → 95%
- Team productivity/output: +45% increase
- Time-to-market: ~25% faster
Product Portfolio Impact
- Redesigned SaaS Hub dashboard for urban management
- Managed 10+ white label mobile apps, launched 3 new (Detroit 4.6/5 app store rating)
- Enhanced core parking app with EV charging, CarPlay, app clips
- Redesigned public transport console bus drivers in the UK
- Improved terminal UX for accessibility and usability
- Drove and delivered MaaS initiatives
Organizational Impact
- Established UX as strategic partner, not production service
- Implemented scalable design operations across 5 platform verticals
- Built comprehensive design systems for web, mobile, and physical terminals
- Redesigned public transport console for UK bus drivers
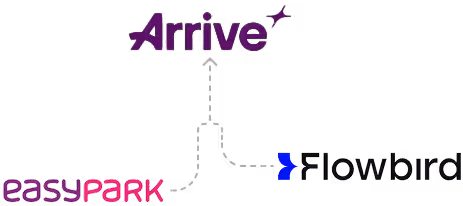
- Successfully navigated team through Flowbird-EasyPark merger (now Arrive)
Skills Demonstrated
Distributed Team Leadership • Design Operations • Strategic Transformation • Design Systems • Agile Practices • Stakeholder Management • International Team Building • Change Management • AI Integration
The Diagnosis: Understanding What Needed to Change

My DesignOps Research Approach
Before making any changes, I conducted a comprehensive audit over several weeks:
Phase 1 Assessment (15 stakeholder interviews):
I interviewed cross-functional team members to understand UX practices, operations, initiative development, communication, and leadership dynamics. I established baselines for time-to-market, team output, and tenure, and reviewed labor laws in each country—especially France, where termination is highly constrained.
Deep Dive into Design Work:
I assessed each team member's strengths, weaknesses, and perspectives. I reviewed the state of design files, current processes, and user knowledge. I became deeply familiar with the products, their history, and the problems they were meant to solve.
The Strategy: A Four-Phase Transformation
Working closely with the CPO + COO, I developed a phased approach to transform UX from liability to strategic asset:
4 Critical Findings
Stakeholders across the organization expressed frustration about UX immaturity, poor cross-team communication, and the "black box" of development handoff. There was a general lack of trust and vision alignment, with no strategy or operations to guide work.
Implication: Rebuilding trust required demonstrating value through measurable outcomes and transparent processes.
Some of talent level was inconsistent for the scope of work. There was no game plan for upcoming team changes due to geopolitical circumstances in Europe.
Implication: A difficult truth—some of the team would need to be replaced with strategic new hires aligned to specific platform verticals.
The Hub dashboard surfaced unusable data because UX wasn't involved in the UI design process. The interface was inconsistent and complicated without clear purpose.
Implication: User research and testing needed to become foundational to the product development process, not optional.
With products spanning mobile apps, SaaS dashboards, physical terminals, and public transport systems across 6,000+ cities in 80+ countries, the lack of design systems and documentation made consistency impossible.
Implication: Design systems weren't a nice-to-have—they were essential infrastructure for an international product portfolio.
Phases
Team Restructuring:
Made the difficult decision that some team members should be let go where legally possible. Began recruiting new talent strategically.
Process Implementation:
Implemented scrum/sprint methodology to create predictable, transparent workflows. Educated adjacent teams that UX was now a strategic partner, not a production service. Established direct, regular communication channels with development teams.
Quick Wins:
Focused on demonstrating immediate value through faster turnaround and clearer communication to build credibility for larger changes ahead.
Strategic Hiring:
Hired new team members assigned to specific platform verticals: mobile (core and white label), SaaS Hub, terminals, and public transport. This created clear ownership and expertise.
Establishing Standards:
- Created standards for Figma file creation and organization
- Implemented daily check-ins for team alignment
- Launched bi-weekly design reviews for quality and learning
- Introduced monthly education lectures to develop skills
- Established regular meetings with development team to review ongoing work
Cultural Shift:
Moved from isolated individual contributors to a collaborative team with shared standards, regular feedback, and continuous learning.
User-Centered Process:
Implemented regular user research and testing with product managers and stakeholders. Began gathering and analyzing metrics to demonstrate impact. Outlined quarterly initiatives aligned to business goals.
Operational Excellence:
- Regular brainstorming sessions for innovation
- Confluence documentation for knowledge management
- Managed backlog with clear prioritization criteria
- Quarterly presentations to leadership showing progress and impact
Design Systems:
Created and managed comprehensive design systems and component libraries for web (SaaS), mobile (core and white label), terminals, and public transport. This was transformational for consistency and speed.
Brand Integration:
Successfully integrated a major brand update across the entire product portfolio.
Continuous Improvement:
Refined processes for maintaining existing products while developing new features. Established operations distinguishing maintenance from innovation work.
Merger Management:
When Flowbird merged with EasyPark (becoming Arrive), I maintained team morale and productivity through transparent communication, soft skills, and proactive alignment with the incoming team. This contributed to the exceptional 95% retention rate during an inherently stressful transition.
Phase 1
Foundation & Restructuring
(Months 1-3)
Team Restructuring:
Made the difficult decision that some team members should be let go where legally possible. Began recruiting new talent strategically.
Process Implementation:
Implemented scrum/sprint methodology to create predictable, transparent workflows. Educated adjacent teams that UX was now a strategic partner, not a production service. Established direct, regular communication channels with development teams.
Quick Wins:
Focused on demonstrating immediate value through faster turnaround and clearer communication to build credibility for larger changes ahead.
Phase 2
Team Building & Standards
(Months 4-9)
Strategic Hiring:
Hired new team members assigned to specific platform verticals: mobile (core and white label), SaaS Hub, terminals, and public transport. This created clear ownership and expertise.
Establishing Standards:
- Created standards for Figma file creation and organization
- Implemented daily check-ins for team alignment
- Launched bi-weekly design reviews for quality and learning
- Introduced monthly education lectures to develop skills
- Established regular meetings with development team to review ongoing work
Cultural Shift:
Moved from isolated individual contributors to a collaborative team with shared standards, regular feedback, and continuous learning.
Phase 3
Maturity & Scale
(Months 10-20)
User-Centered Process:
Implemented regular user research and testing with product managers and stakeholders. Began gathering and analyzing metrics to demonstrate impact. Outlined quarterly initiatives aligned to business goals.
Operational Excellence:
- Regular brainstorming sessions for innovation
- Confluence documentation for knowledge management
- Managed backlog with clear prioritization criteria
- Quarterly presentations to leadership showing progress and impact
Design Systems:
Created and managed comprehensive design systems and component libraries for web (SaaS), mobile (core and white label), terminals, and public transport. This was transformational for consistency and speed.
Brand Integration:
Successfully integrated a major brand update across the entire product portfolio.
Phase 4
Optimization & Merger Navigation
(Months 21-33)
Continuous Improvement:
Refined processes for maintaining existing products while developing new features. Established operations distinguishing maintenance from innovation work.
Merger Management:
When Flowbird merged with EasyPark (becoming Arrive), I maintained team morale and productivity through transparent communication, soft skills, and proactive alignment with the incoming team. This contributed to the exceptional 95% retention rate during an inherently stressful transition.
AI Integrated Into Design Operations:
I introduced AI to accelerate research synthesis, reducing stakeholder interview analysis from 2-3 days to 4-6 hours. However, I established a critical governance rule: AI-generated insights required human verification before informing design decisions.
The Execution: Transforming the Product Portfolio

5 Integrated Product Platforms:
With operations stabilized and a high-performing team in place, we tackled the diverse product portfolio with strategic focus. This section illustrates how design maturity manifested across platform verticals.
Project 1:
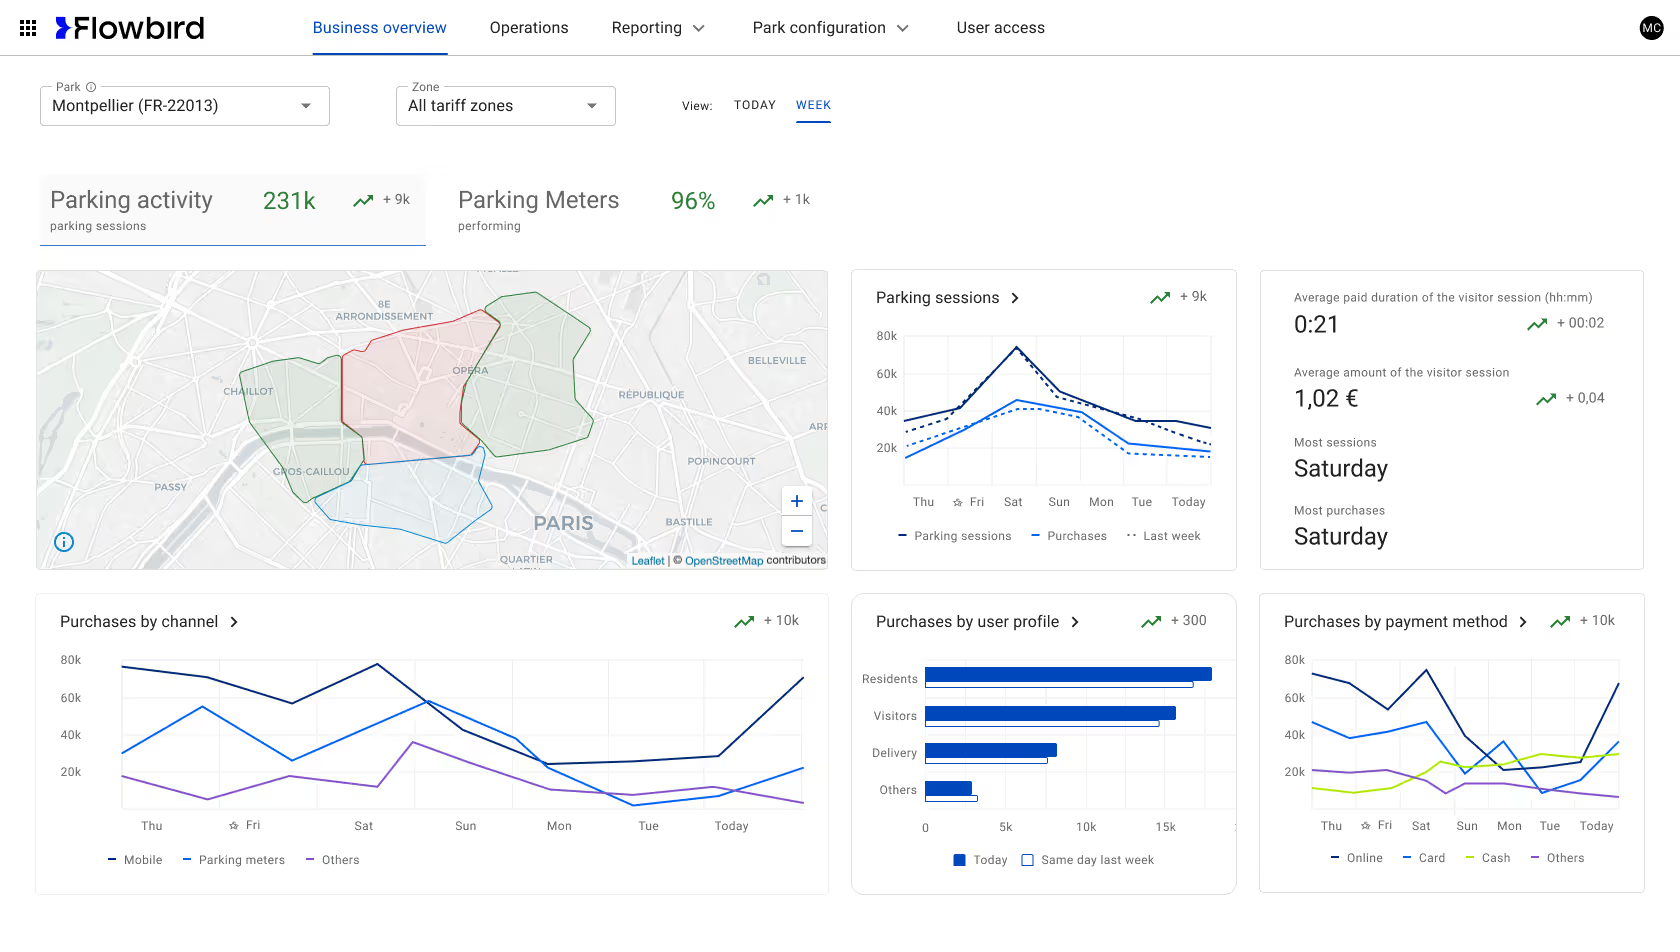
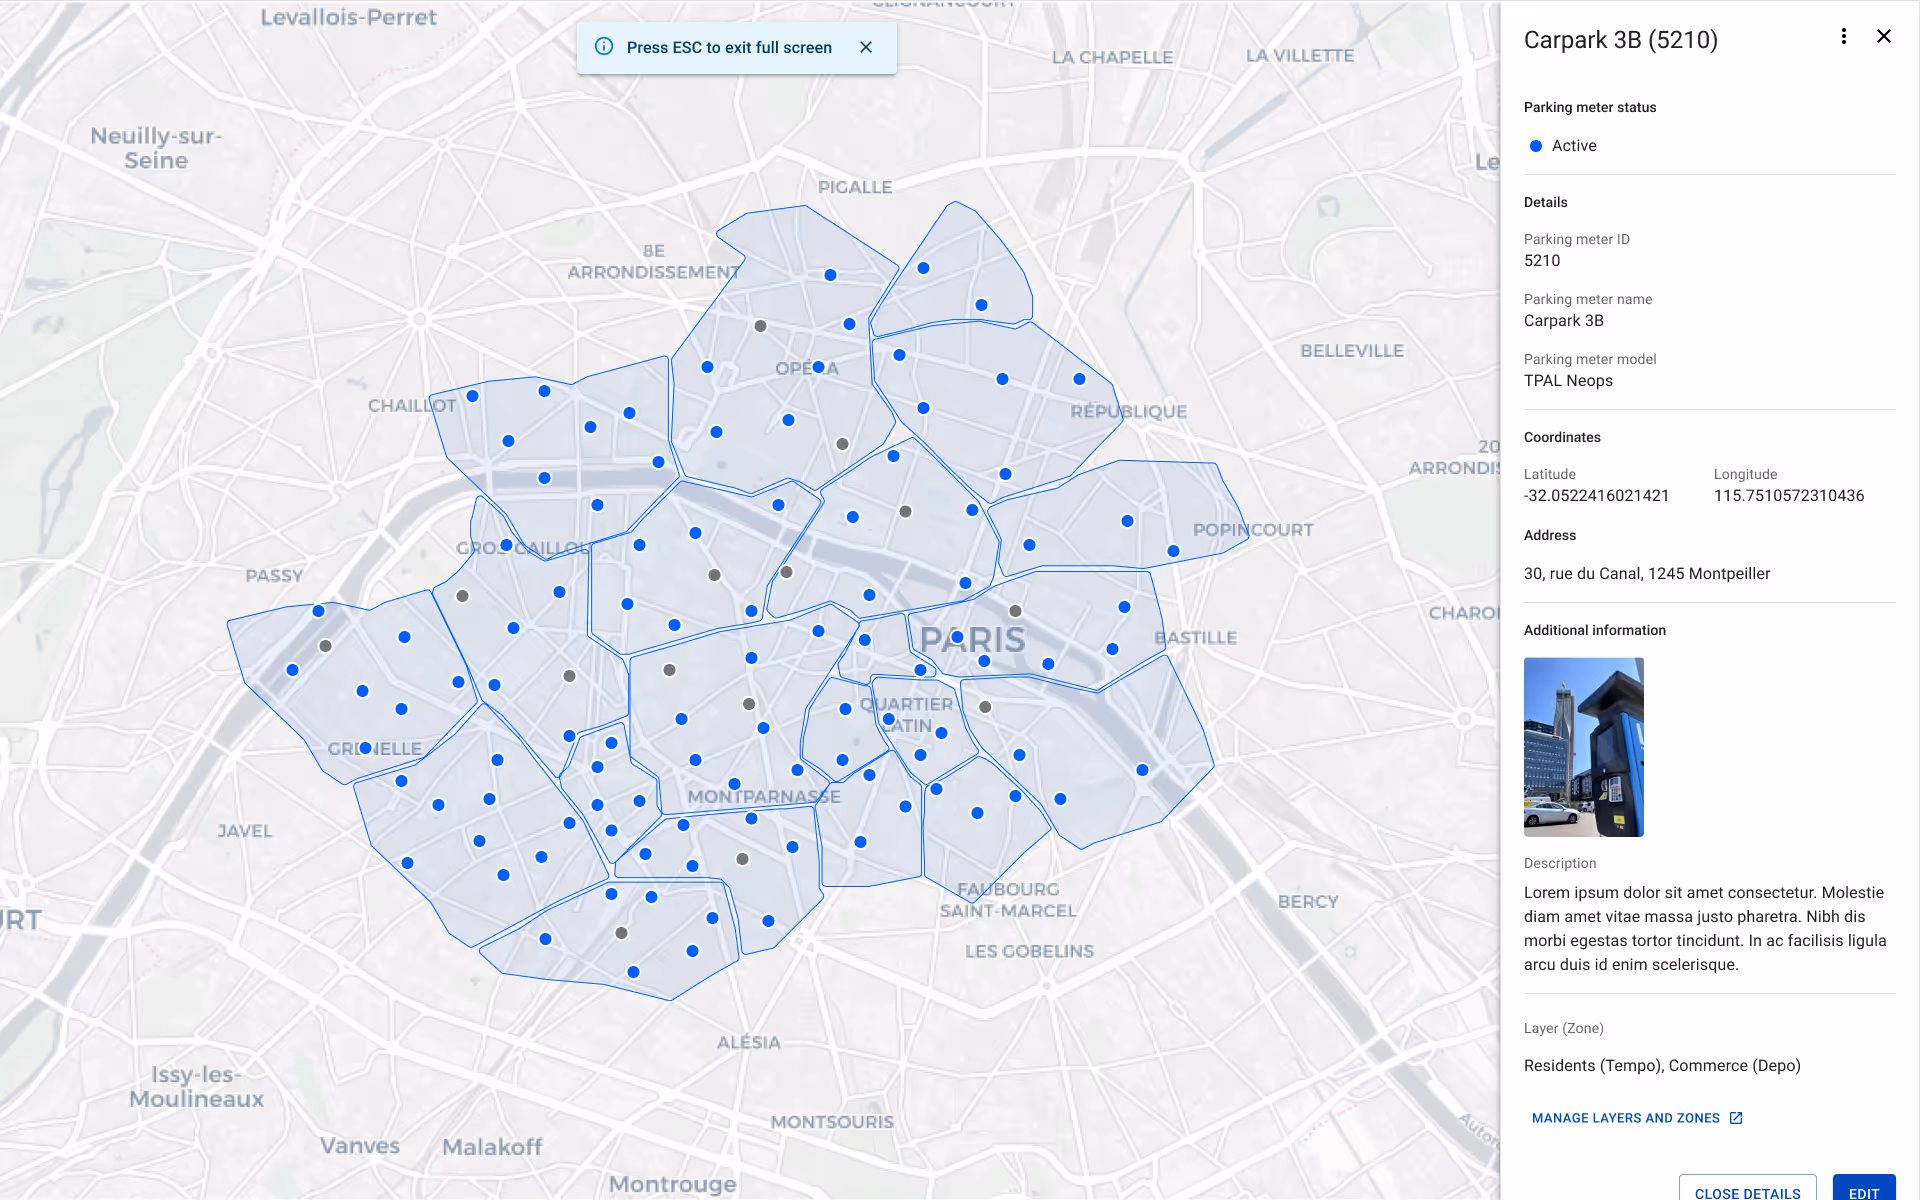
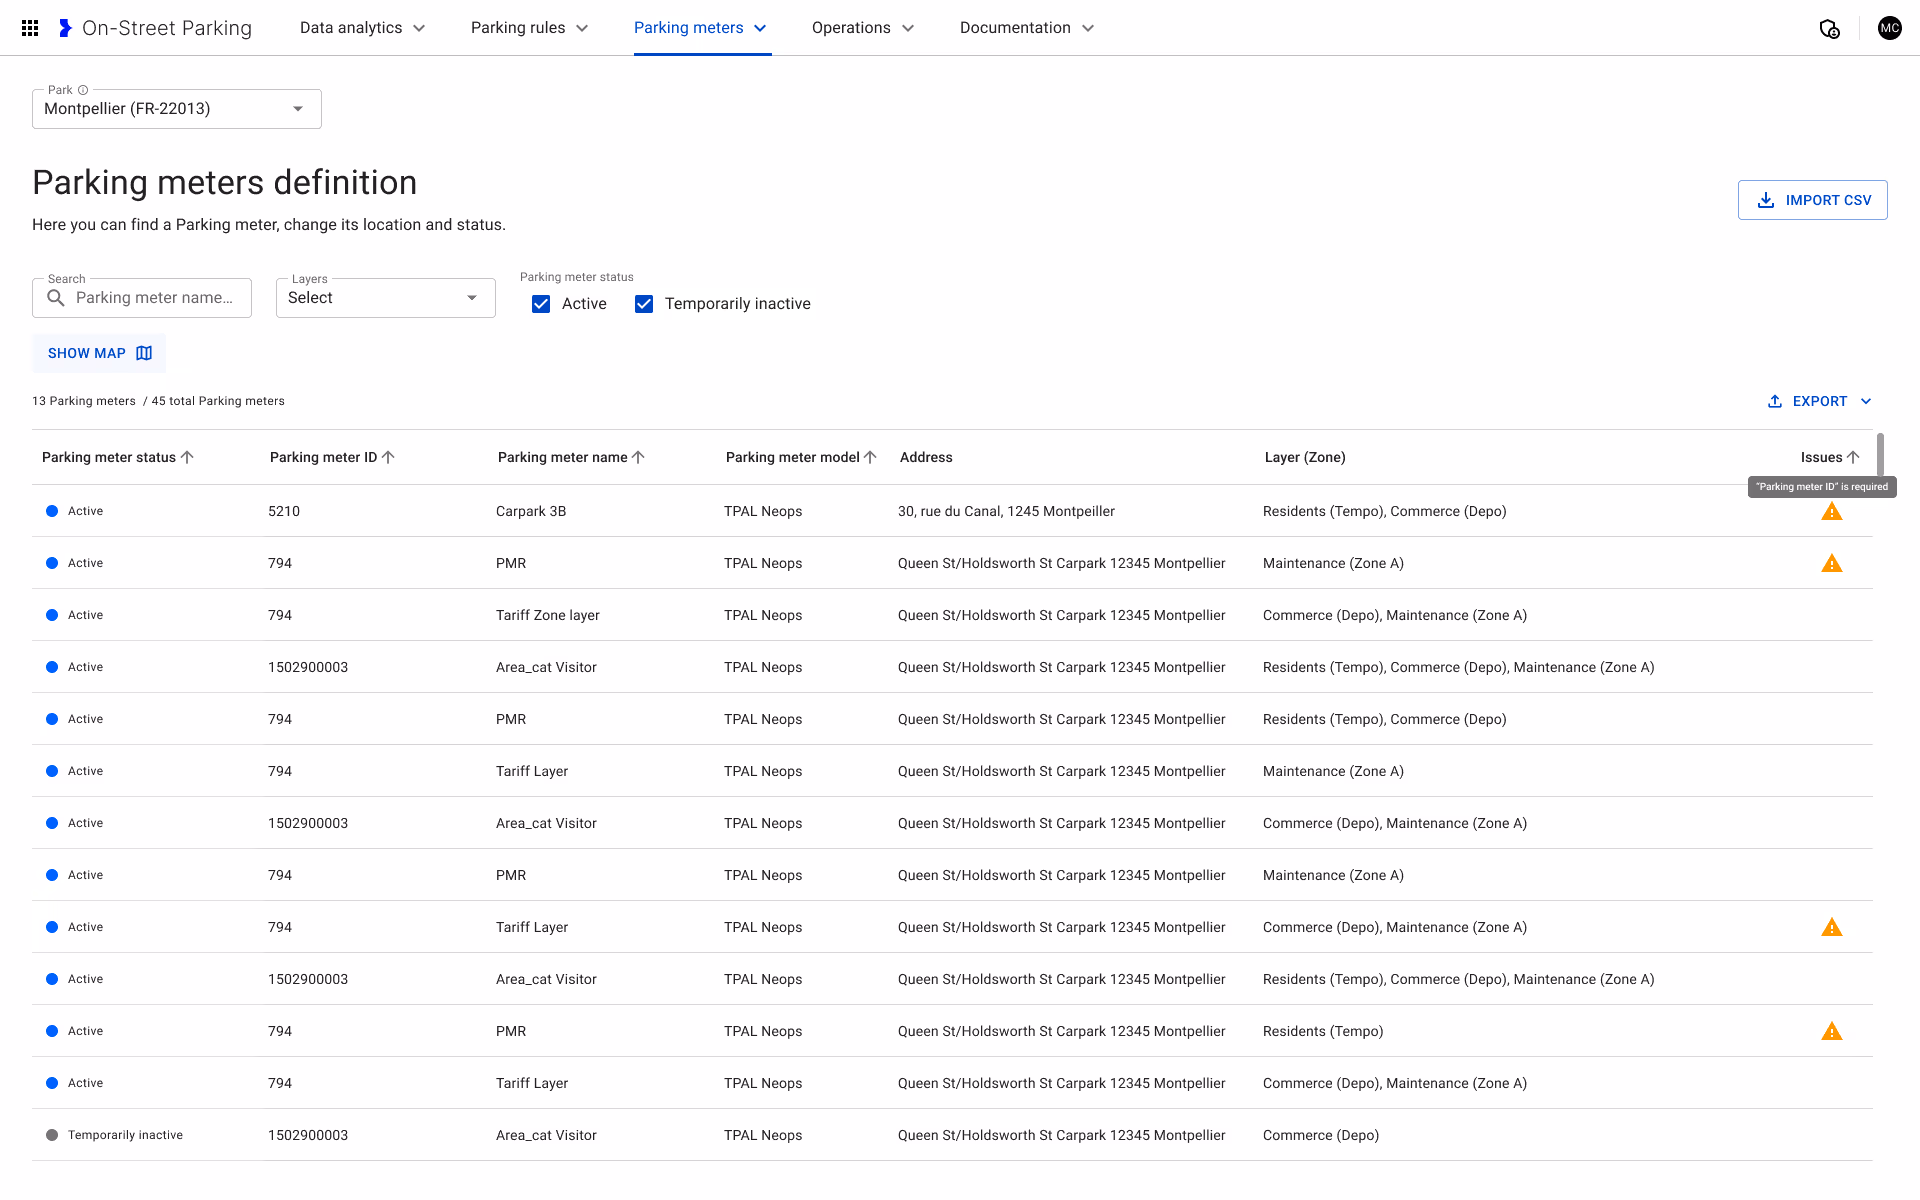
SaaS Hub Dashboard Redesign
The Challenge:
Operators managing parking and meter activity across cities couldn't find critical information. Data visualization was poor. The UI was inconsistent and complicated without clear purpose. Users needed the ability to simulate tariff changes before implementing them to understand implications.
The Purpose:
Provide city operators with a full view of parking and meter activity, issue notifications, terminal monitoring, zone and tariff management, income tracking, tariff simulations, and comprehensive reporting with AI-assisted chat.
User Benefit:
Better understand and manage urban behavior related to traffic and parking. Get clear understanding of fluctuations by date and time. Address emergencies quickly. Monitor revenue effectively.
Our Design Approach:
Deep vertical information architecture with surface-level insights and drill-downs, clear metrics and visualizations, scalable design with white space and hierarchy, map-based zone indicators, and integrated AI chat for flexible reporting.
Operators managing parking and meter activity across cities couldn't find critical information. Data visualization was poor. The UI was inconsistent and complicated without clear purpose. Users needed the ability to simulate tariff changes before implementing them to understand implications.
Provide city operators with a full view of parking and meter activity, issue notifications, terminal monitoring, zone and tariff management, income tracking, tariff simulations, and comprehensive reporting with AI-assisted chat.
Better understand and manage urban behavior related to traffic and parking. Get clear understanding of fluctuations by date and time. Address emergencies quickly. Monitor revenue effectively.
Deep vertical information architecture with surface-level insights and drill-downs, clear metrics and visualizations, scalable design with white space and hierarchy, map-based zone indicators, and integrated AI chat for flexible reporting.
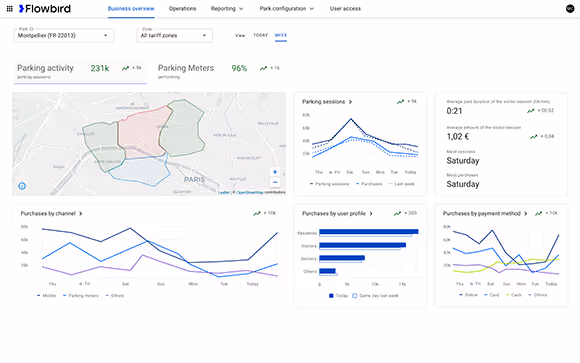
Business overview
Business overview purchases quick view
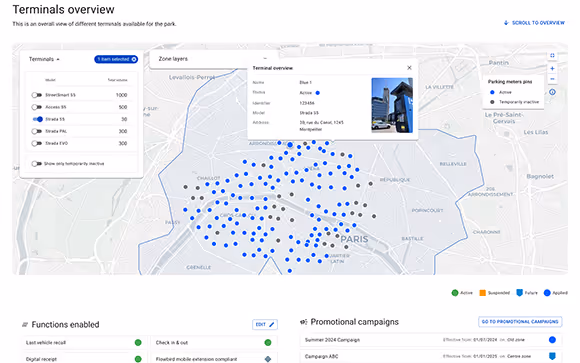
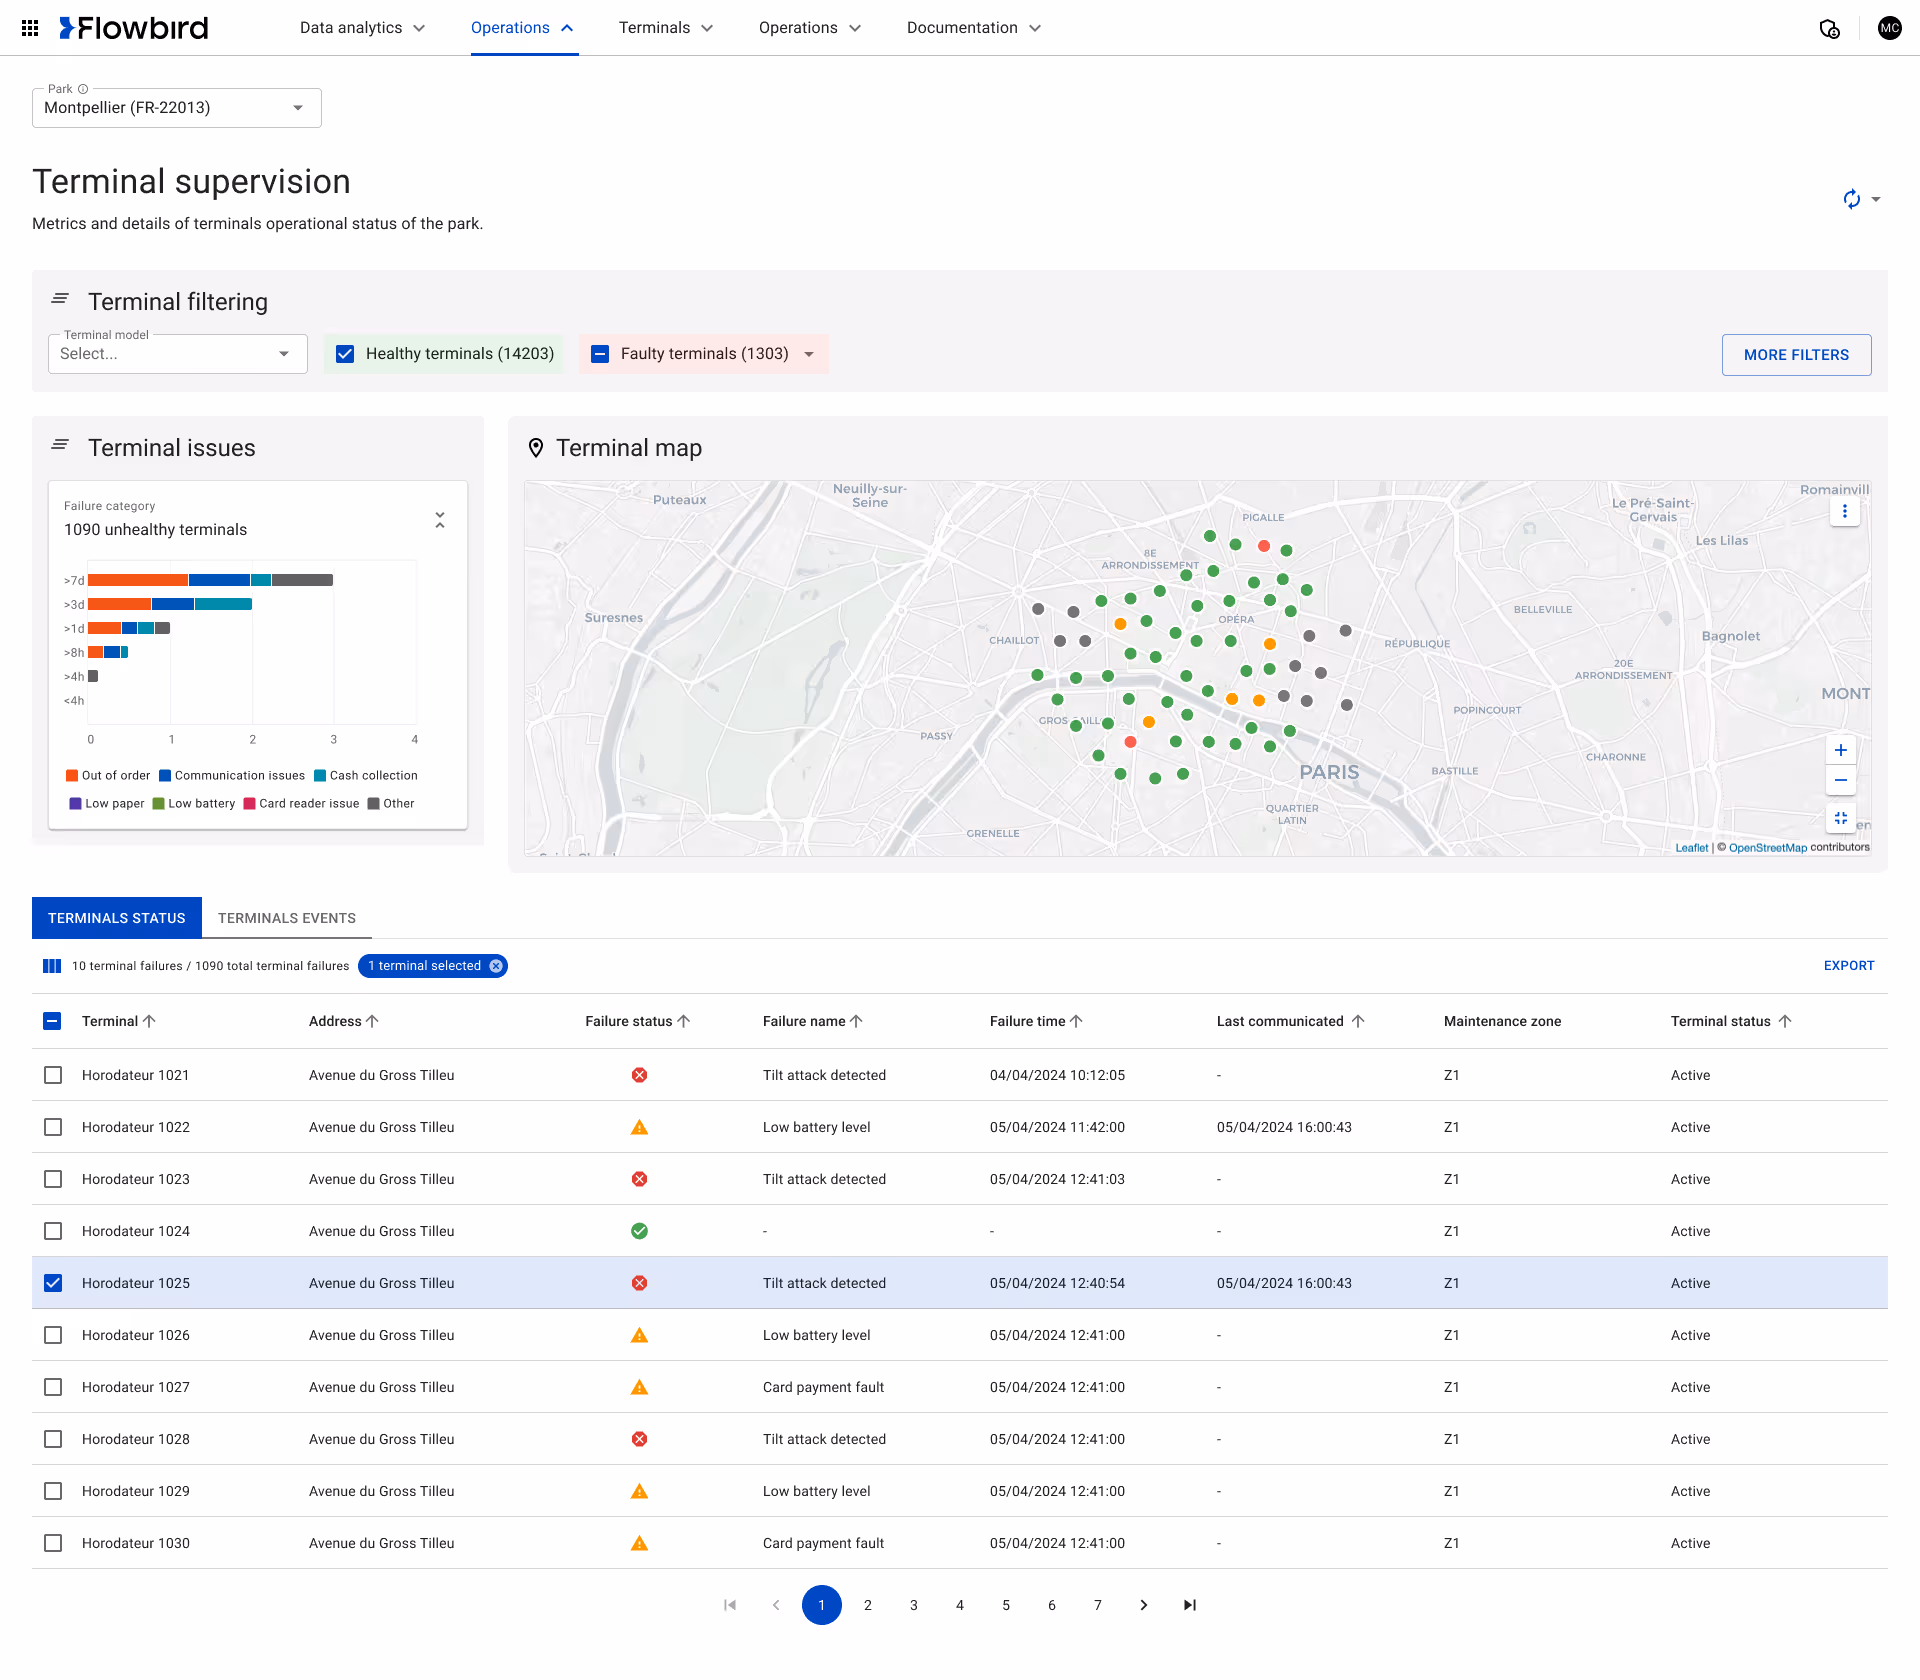
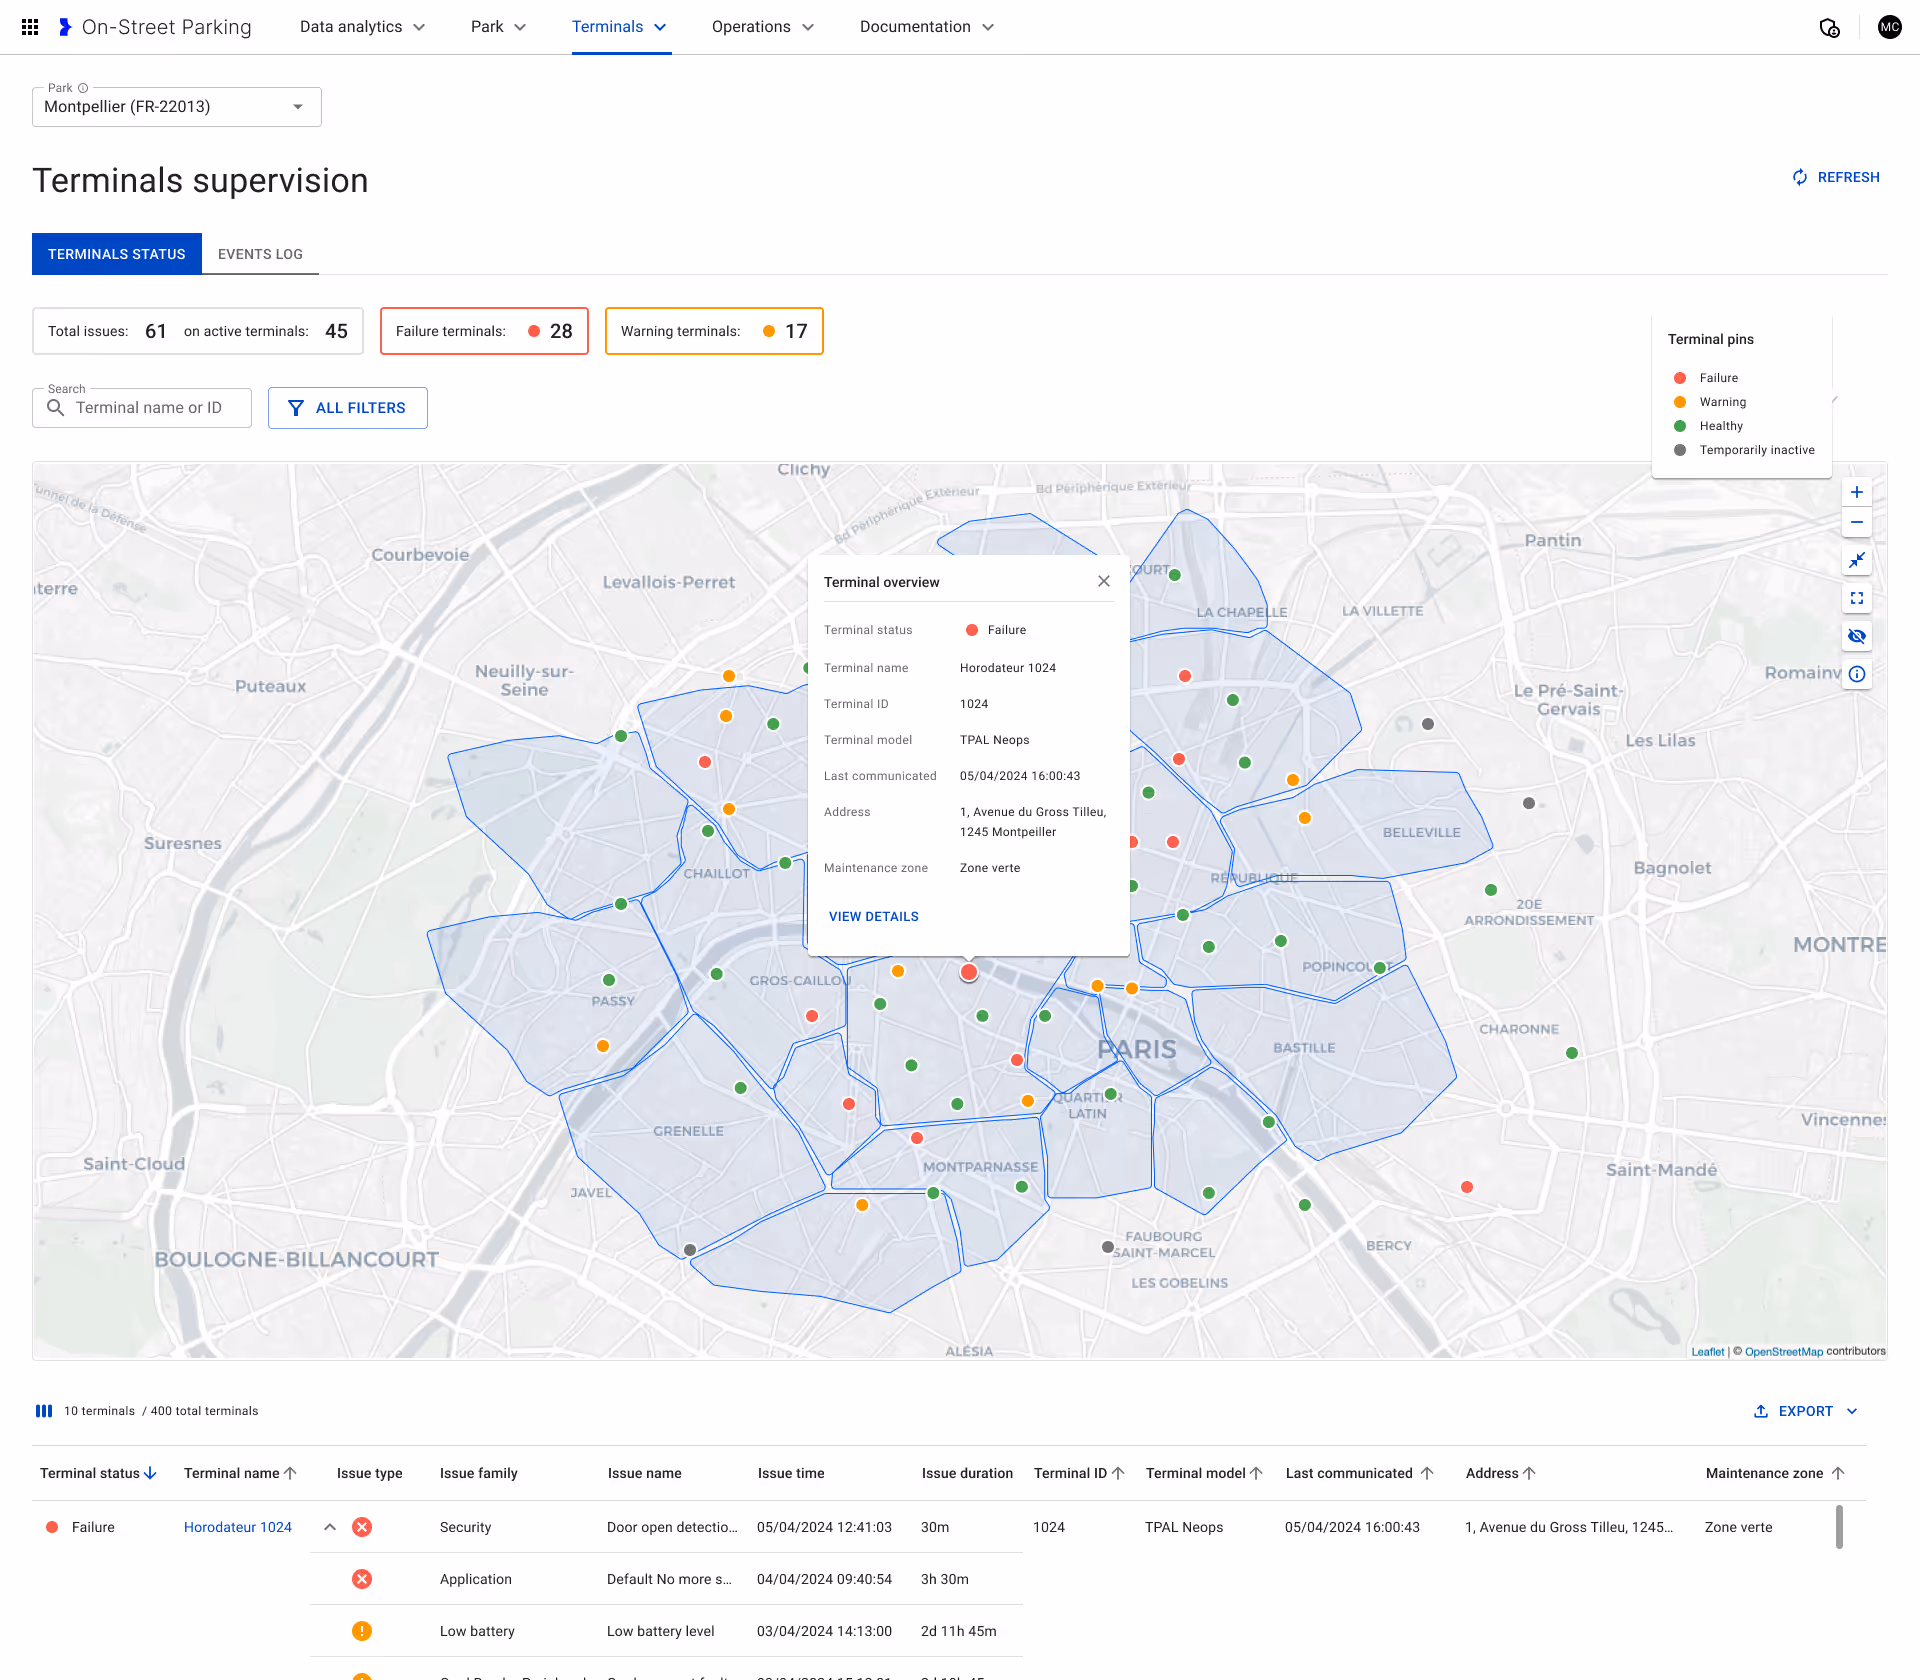
Overview of terminals status
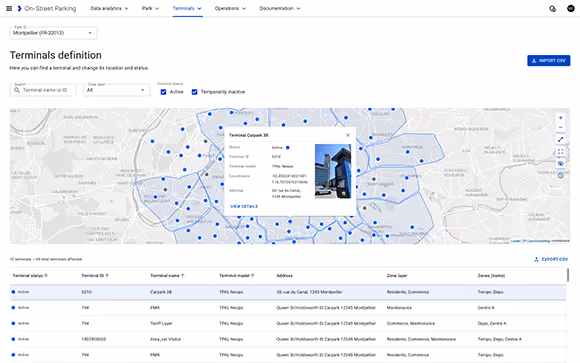
Overview of terminals status

Supervise terminals
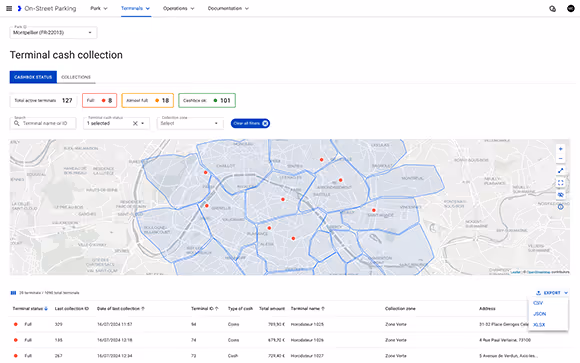
Cash Collection of Terminals Details

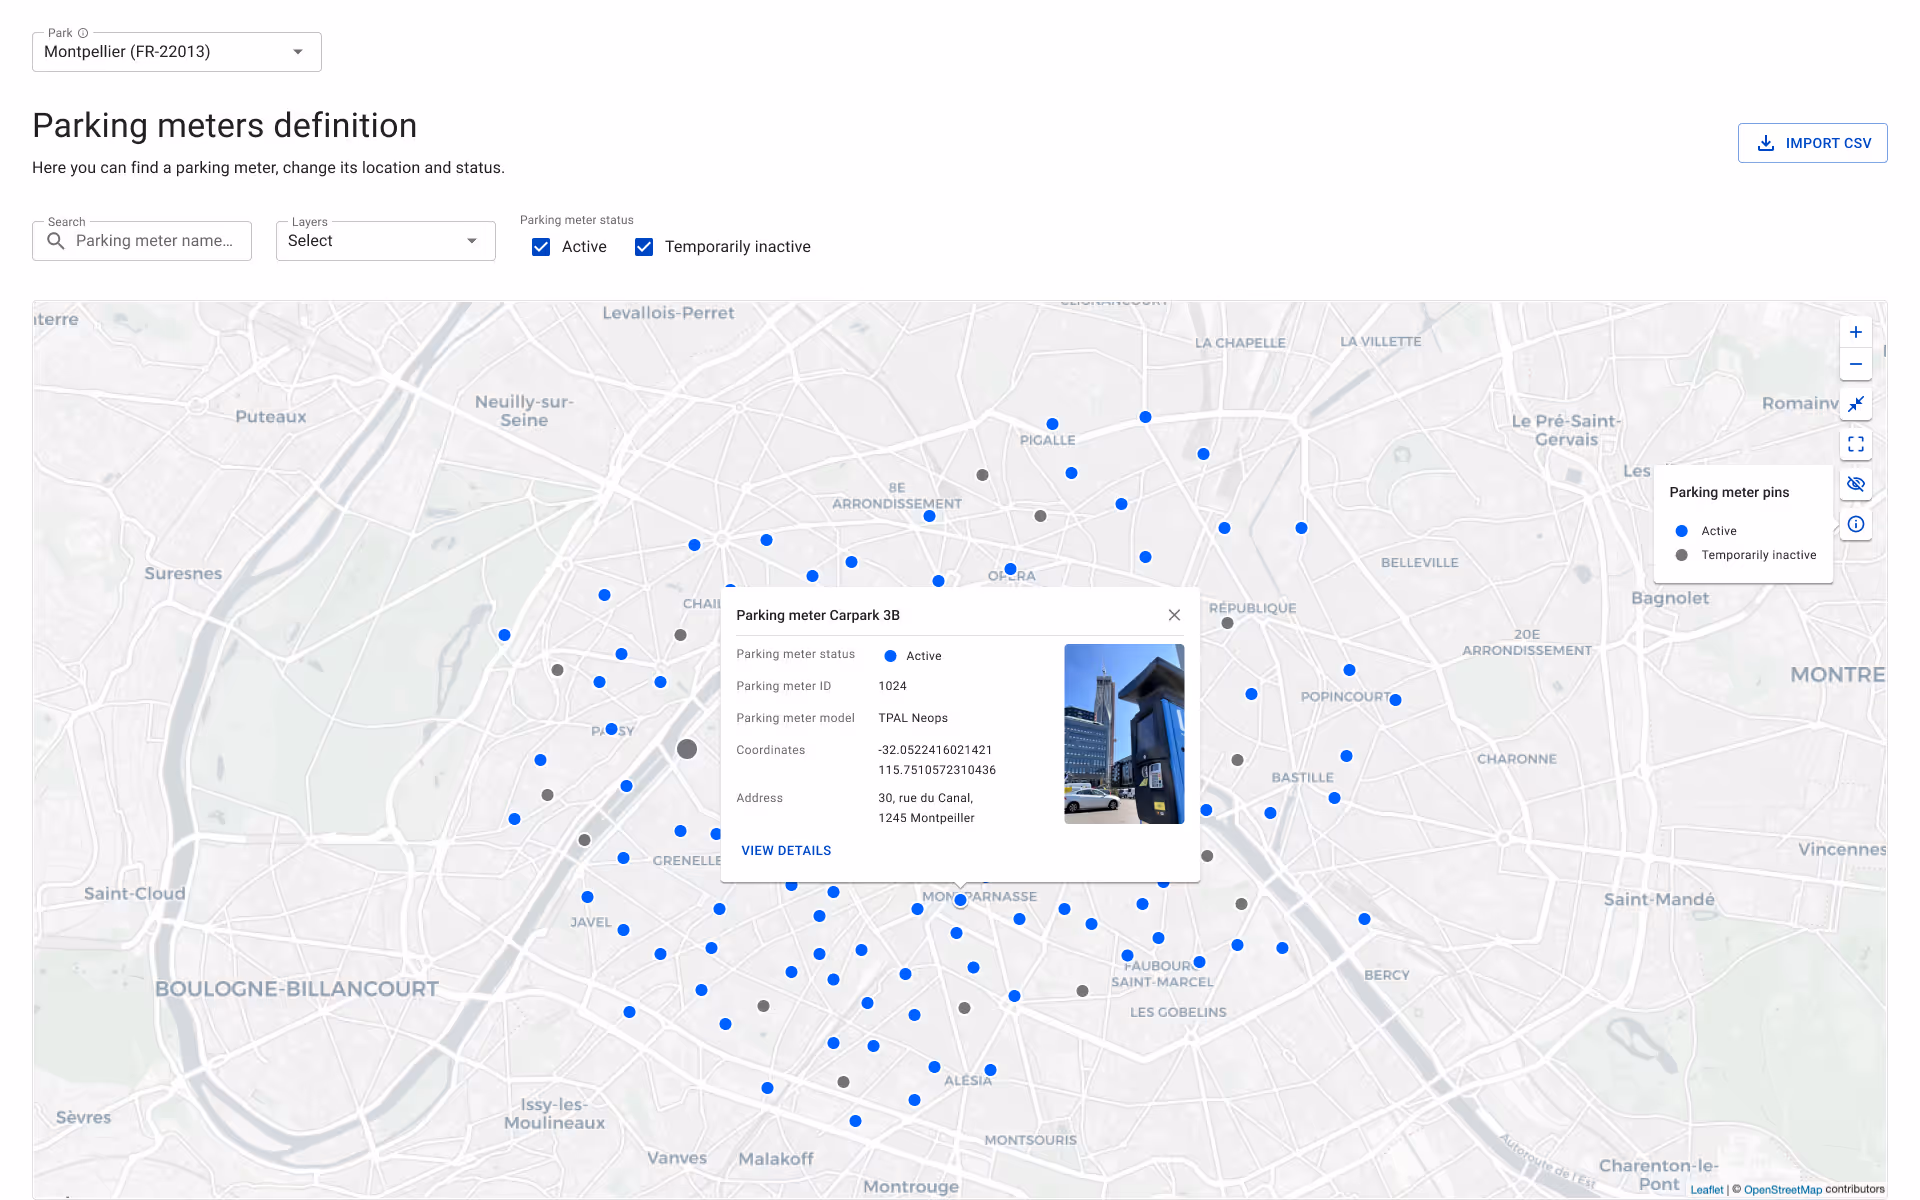
Configure Park Areas
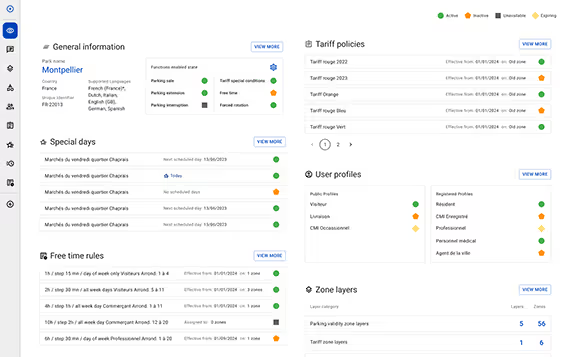
Park Configuration Overview Details
AI Report Generation

Revenue Simulation
AI Integration Content
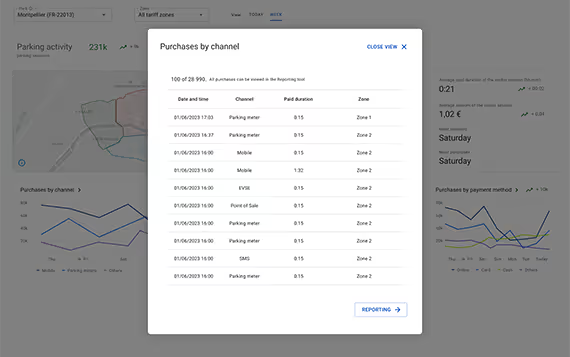
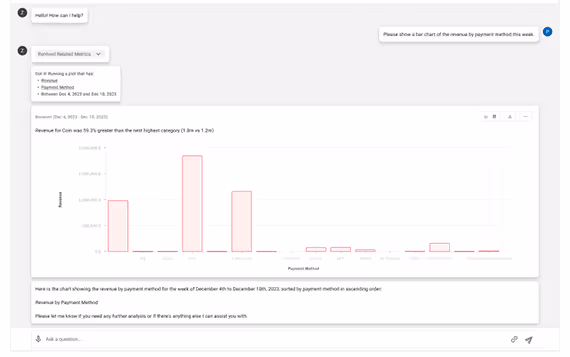
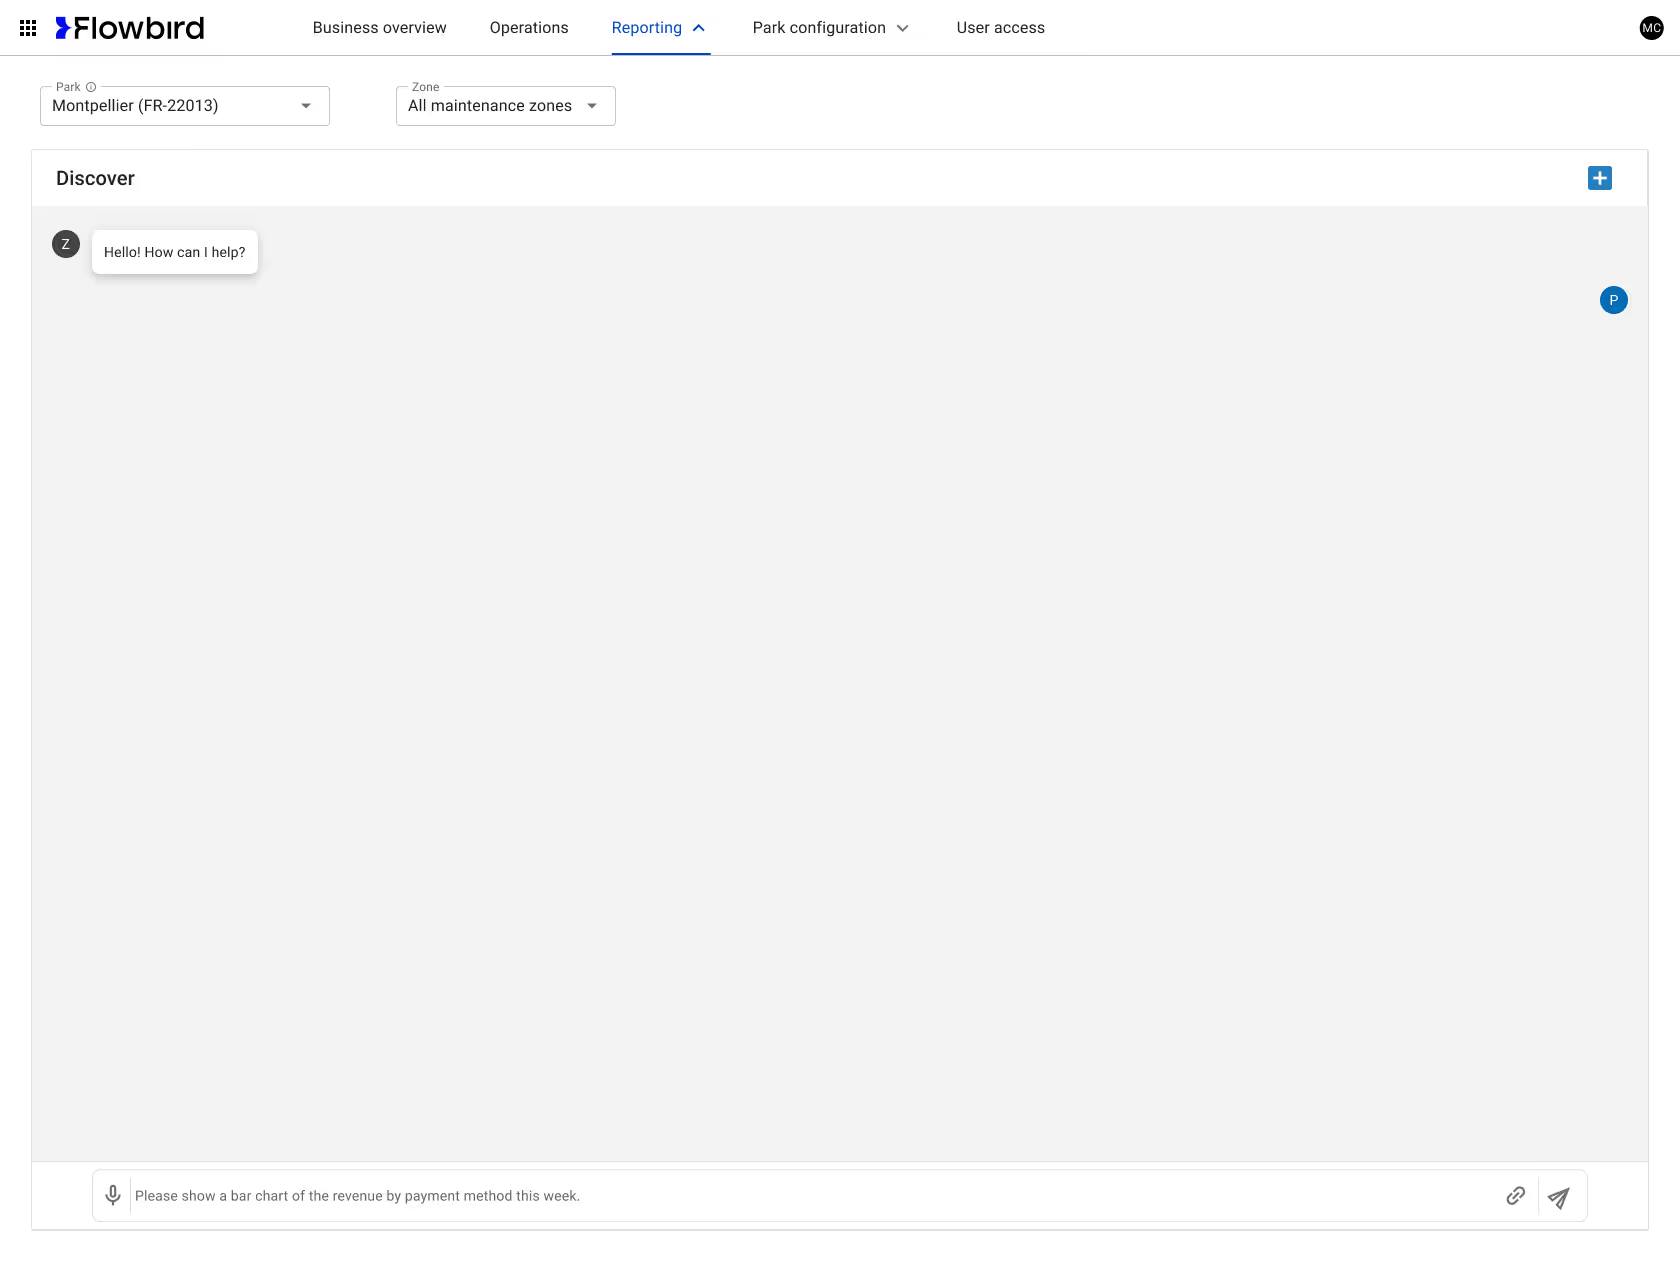
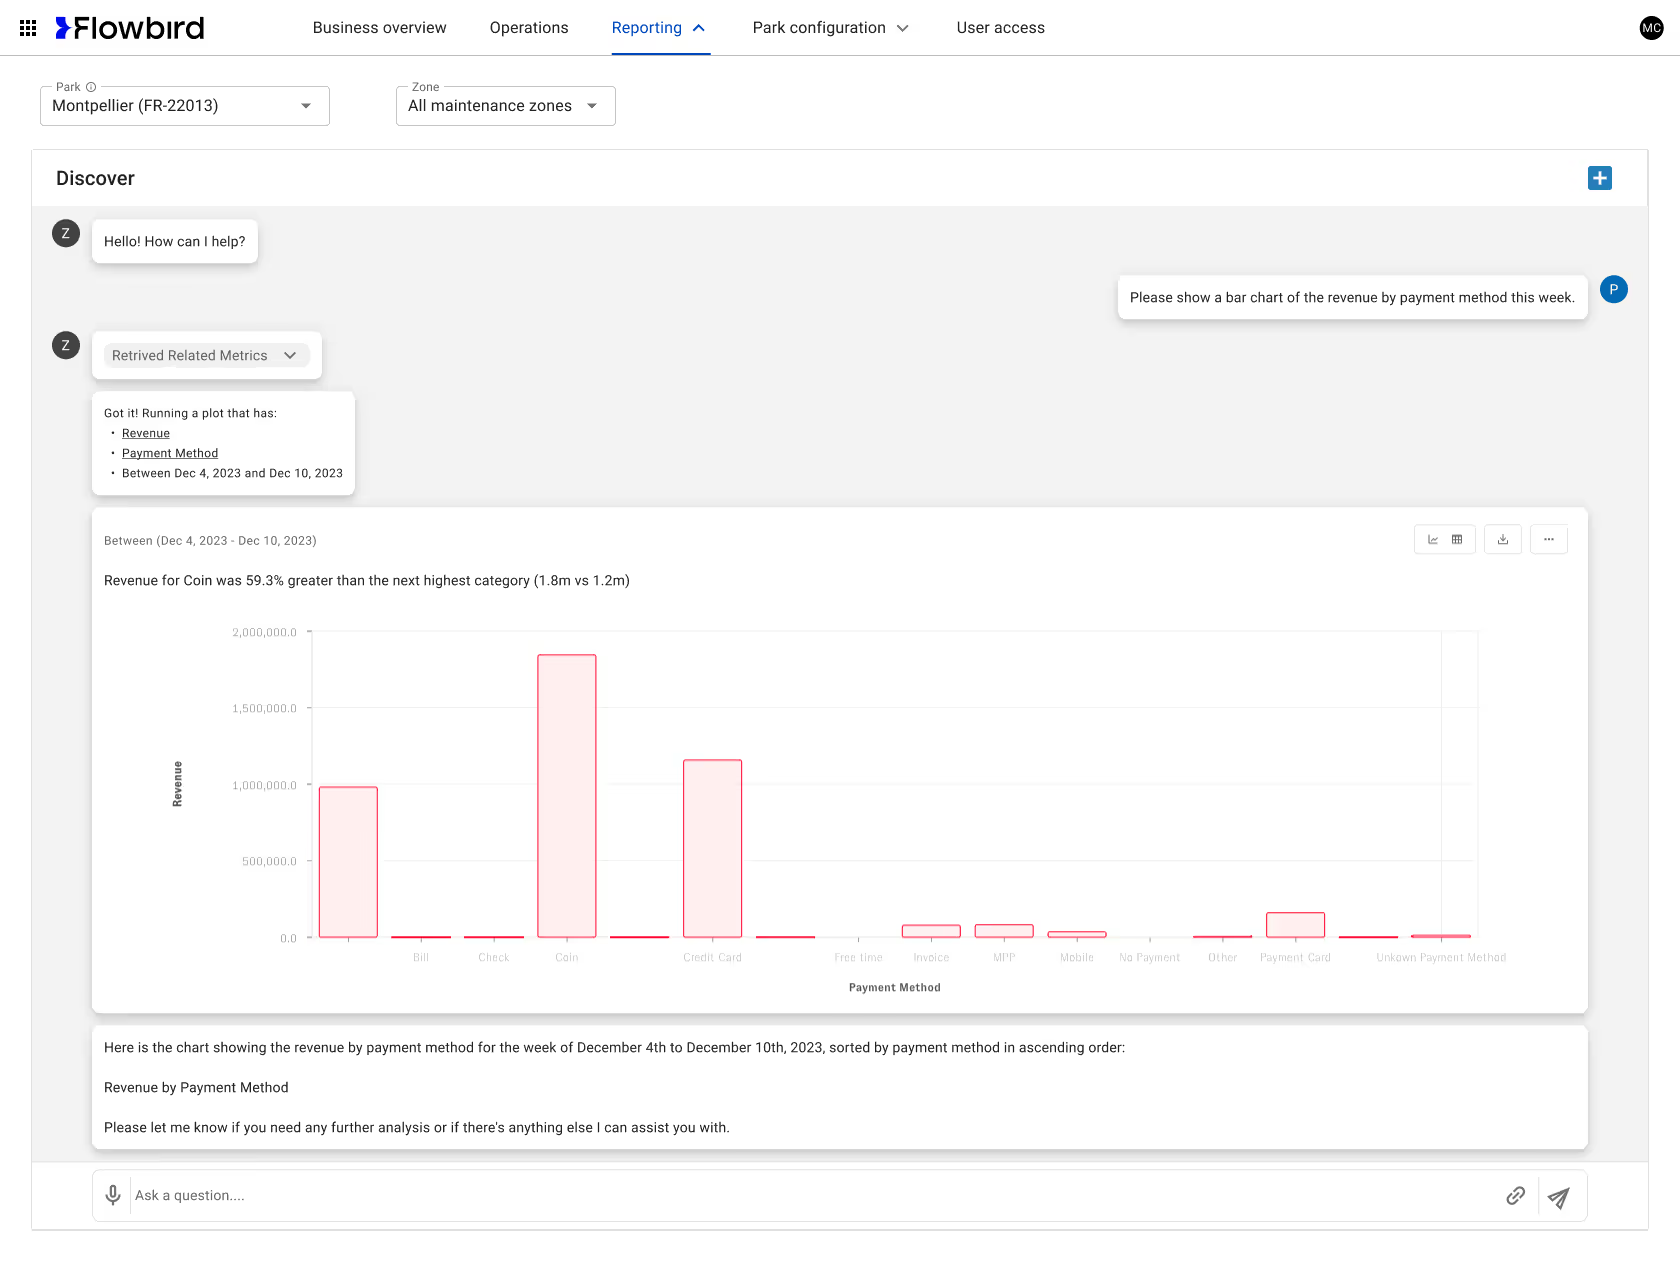
AI-Powered Reporting & Insights
Introduced an AI-driven reporting assistant that enables operators to generate complex revenue insights using natural language. Users can ask plain-English questions (e.g., revenue by payment method or time range), instantly retrieve relevant metrics, and view auto-generated visualizations with contextual summaries—reducing reporting friction and accelerating decision-making for non-technical users.
Testing & Iteration Examples
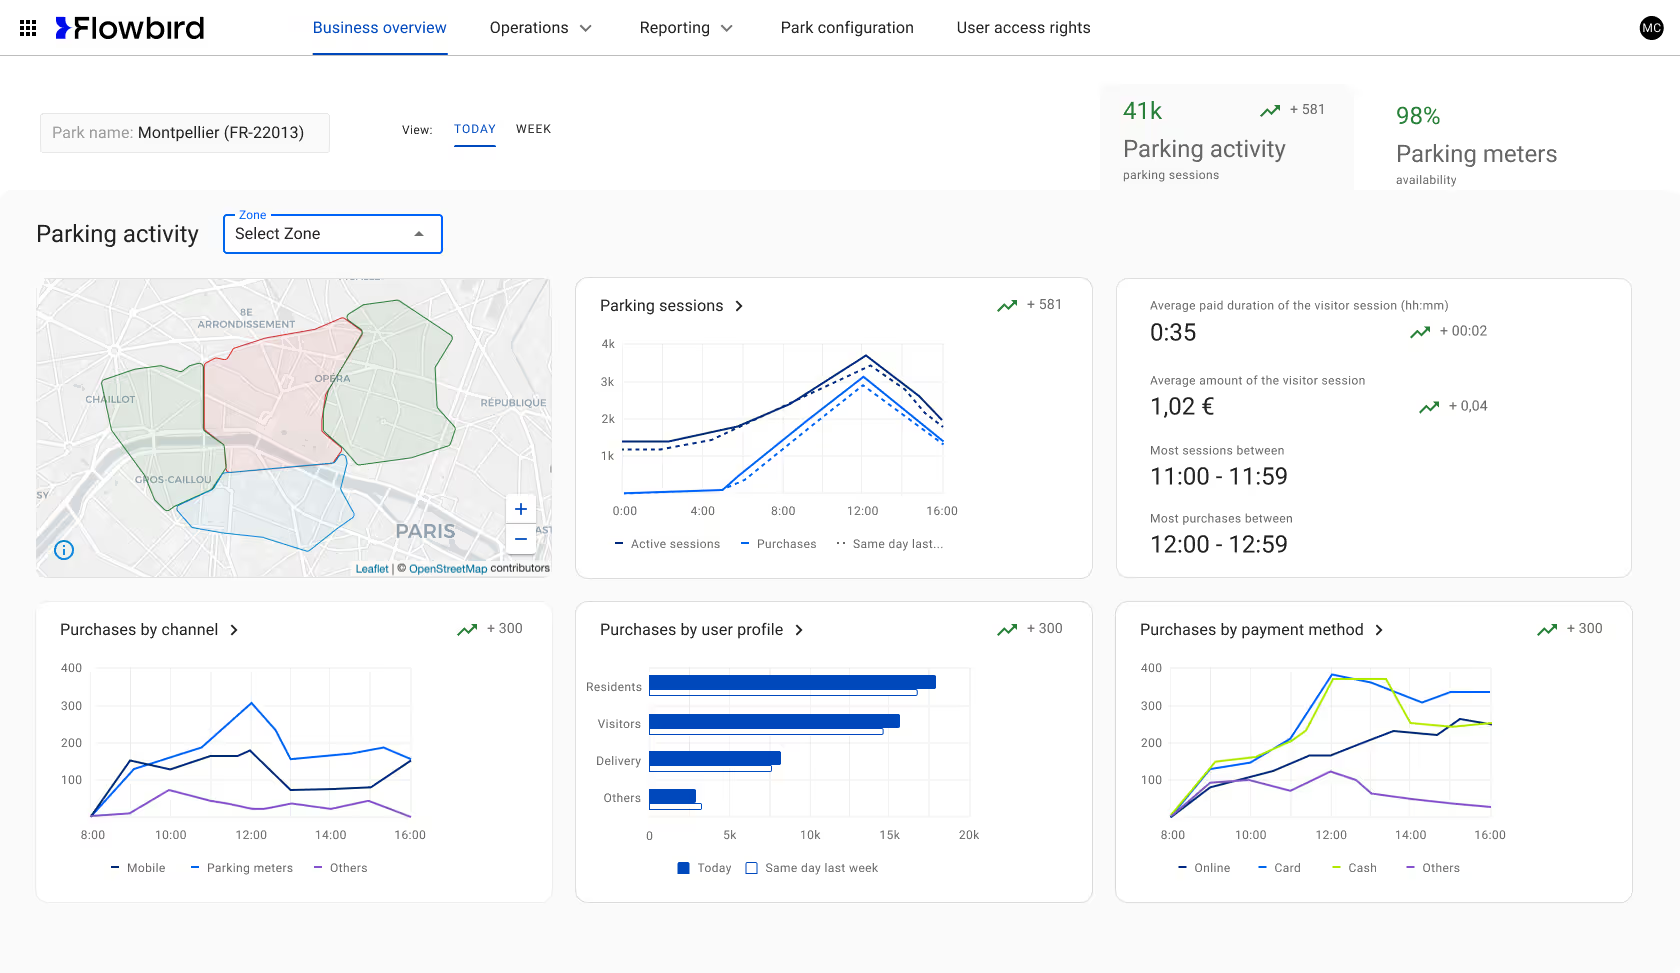
Business Overview Page Transformation
Redesigned the business overview page to clearly present parking activity and meter status. Improved tab visibility, clarified relationships between labels, indicators, and sparklines, resulting in near-universal user comprehension in testing.
First design
After testing / iteration
Additional evolutions that affected most pages
Over time, it became clear that the map feature was an essential tool to many use cases and work flows. Additional testing revealed the need to rethink the placement of filters and tabs.
First design
After testing / iteration
Implementation of map UI flexibility
Although the map feature clearly a essential tool for most use cases, different use cases and users required varying emphasis on the map function.
Default
Minimized

Full screen
Map hidden
Project 2:
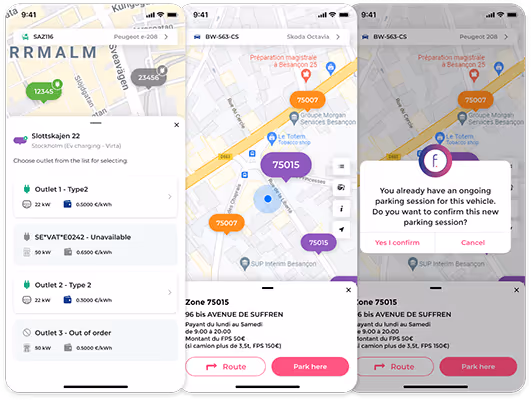
Branded Consumer Mobile App Enhancements
The Challenge:
The Flowbird mobile app needed to compete with EasyPark and other market leaders. Research revealed key pain points: users needed faster park-and-pay UX, updated EV charging integration, quicker payment method input, and consistency with emerging technologies like app clips and CarPlay.
The Purpose:
Create a best-in-class solution making payments effortless. Design for flexibility adapting to various parking needs: PayByPlate, PayBySpace, on-street and off-street parking, and EV charging. Support multiple payment options: transactional, post-payment, and eWallets including Apple Pay, Google Pay, and national wallets.
User Benefit:
Fast, easy task completion during the inherently stressful process of finding and paying for parking. Reduced cognitive load through clear design system consistency. Flexibility to match diverse parking scenarios across cities and countries.
Design Approach:
Maintained rigorous consistency through a comprehensive design system. Optimized every task for speed since users are typically in time-sensitive, stressful situations. Prioritized clarity and reduced steps wherever possible.
The Flowbird mobile app needed to compete with EasyPark and other market leaders. Research revealed key pain points: users needed faster park-and-pay UX, updated EV charging integration, quicker payment method input, and consistency with emerging technologies like app clips and CarPlay.
Create a best-in-class solution making payments effortless. Design for flexibility adapting to various parking needs: PayByPlate, PayBySpace, on-street and off-street parking, and EV charging. Support multiple payment options: transactional, post-payment, and eWallets including Apple Pay, Google Pay, and national wallets.
Fast, easy task completion during the inherently stressful process of finding and paying for parking. Reduced cognitive load through clear design system consistency. Flexibility to match diverse parking scenarios across cities and countries.
Maintained rigorous consistency through a comprehensive design system. Optimized every task for speed since users are typically in time-sensitive, stressful situations. Prioritized clarity and reduced steps wherever possible.
Key Features Delivered:
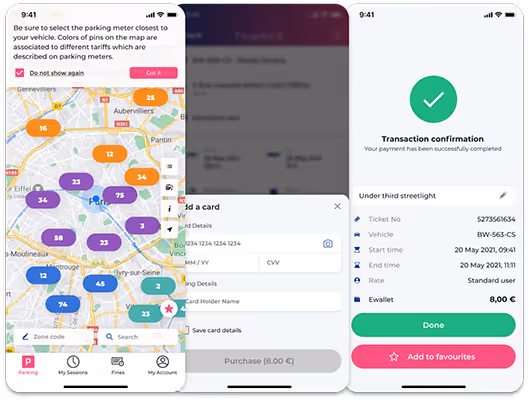
Guest mode for occasional users enabling quick parking payments

Remote ticket extension with just a few taps

Stop-at-the-minute precision (pay only for exact duration)
Real-time parking availability data
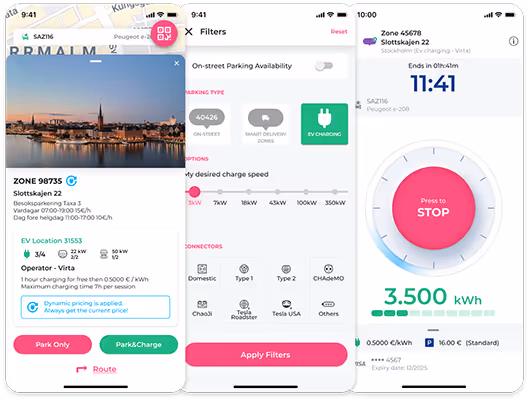
Park and charge EV functionality
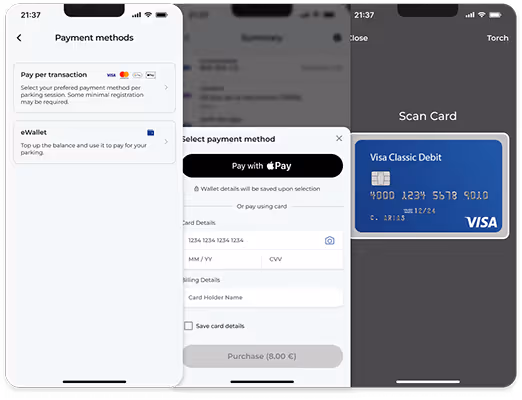
Pay-as-you-go with Hyperswitch integration

App clips, widgets, and live activity
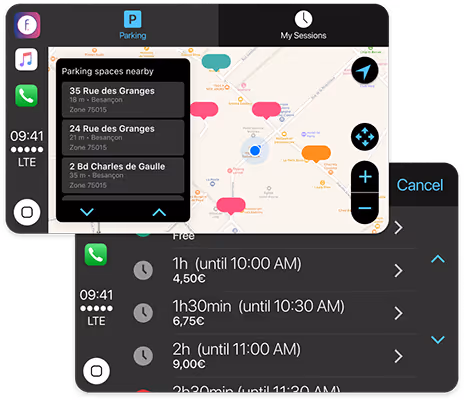
Carplay integration
Project 3: White Label App Portfolio
The Challenge:
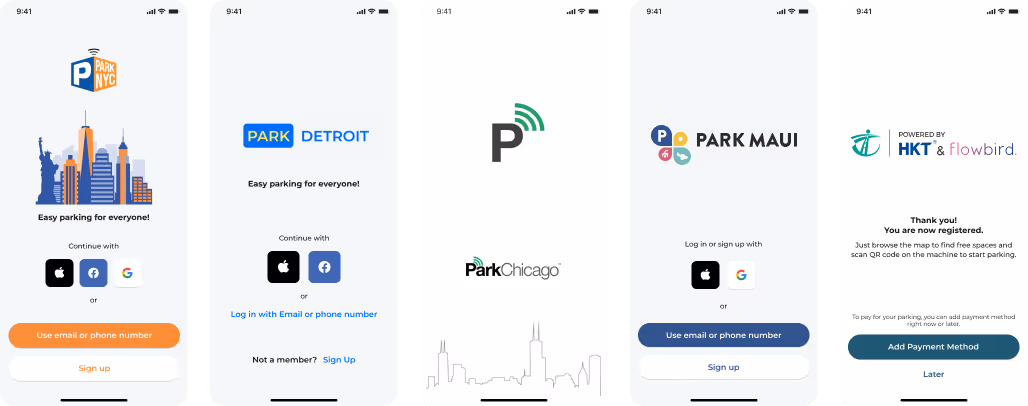
Cities required fully customized, city-branded versions of the Flowbird platform with unique events, benefits, and parking flows. We delivered 10+ white-label apps—including Detroit, Maui, Chicago, NYC, and Hong Kong—scaling deep customization while maintaining quality and efficiency.
The Purpose:
Create city-specific versions of the core platform that serve unique municipal needs while maintaining underlying technical and design consistency.
User Benefit:
For Drivers: More customized city experience tailored to unique local features, events, and benefits.
For City Operators: Ability to serve specific needs of their citizens and uniquely manage their city's parking ecosystem.
Design Approach:
Defined platform strategy by mapping core vs. city-specific needs, conducting workshops, creating detailed user journeys, and developing city-tailored design system requirements while preserving the core component library.
Cities required fully customized, city-branded versions of the Flowbird platform with unique events, benefits, and parking flows. We delivered 10+ white-label apps—including Detroit, Maui, Chicago, NYC, and Hong Kong—scaling deep customization while maintaining quality and efficiency.
Create city-specific versions of the core platform that serve unique municipal needs while maintaining underlying technical and design consistency.
For Drivers: More customized city experience tailored to unique local features, events, and benefits.
For City Operators: Ability to serve specific needs of their citizens and uniquely manage their city's parking ecosystem.
Defined platform strategy by mapping core vs. city-specific needs, conducting workshops, creating detailed user journeys, and developing city-tailored design system requirements while preserving the core component library.
Testing & Iteration Example
Case Study: ParkChicago Wallet Innovation
One of Chicago's requirements was a wallet feature users had to "load" rather than charging a defined card directly. This created a critical UX challenge during transactions when wallet balance was insufficient.
Initial Design:
Wallet would auto-reload based on the amount previously authorized in settings.
Final version

First version

User Testing Feedback:
Participants liked the convenience but expressed concern over not clearly understanding their pre-set reload amount and not having the ability to choose a reload amount during the transaction process.
Second version
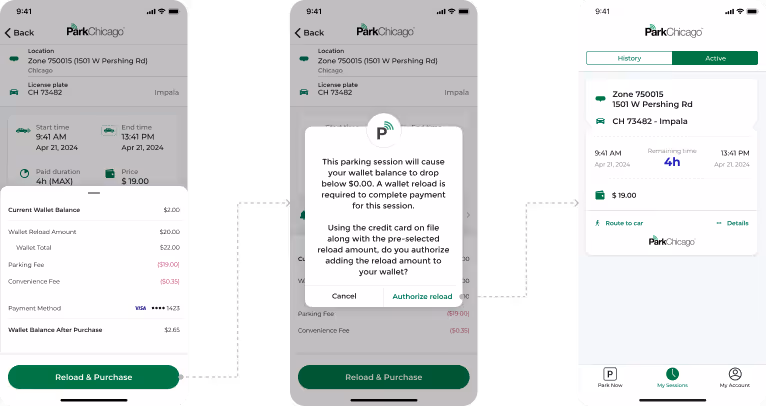
Final iteration:
Participants greatly appreciated the increased control over their wallet (a sensitive issue) without delaying parking payment completion. Given that parking often happens in time-sensitive, potentially stressful situations, this was an important win for the Chicago app.
Project 4: Public Transport Console for UK Bus Drivers
The Challenge:
UK bus drivers needed a low-distraction interface that better supported ticketing, route indication, telematics, and essential messages; the existing system was cumbersome and competed with safe driving.
The Purpose:
CloudFare is an innovative cloud back-office solution dedicated to transport fare collection (Account Based Ticketing and Card Based Ticketing). It provides comprehensive business modules for efficient management of single-mode or multimodal transport networks.
UK bus drivers needed a low-distraction interface that better supported ticketing, route indication, telematics, and essential messages; the existing system was cumbersome and competed with safe driving.
CloudFare is an innovative cloud back-office solution dedicated to transport fare collection (Account Based Ticketing and Card Based Ticketing). It provides comprehensive business modules for efficient management of single-mode or multimodal transport networks.
Prioritized non-distracting interface design recognizing that driving is the primary task. Created clear visual hierarchy for critical information (route, next stop, important messages). Made ticketing interactions as simple and quick as possible. Designed for tablet form factor allowing large, mobile screen interaction suitable for vehicle mounting.
Design Approach:
Prioritized non-distracting interface design recognizing that driving is the primary task. Created clear visual hierarchy for critical information (route, next stop, important messages). Made ticketing interactions as simple and quick as possible. Designed for tablet form factor allowing large, mobile screen interaction suitable for vehicle mounting.

Duty routes selection
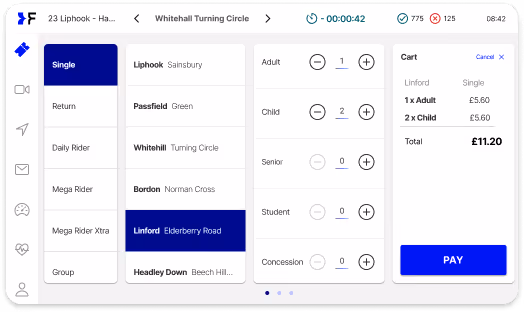
Tickets

AVL (Automatic vehicle location)

Messages
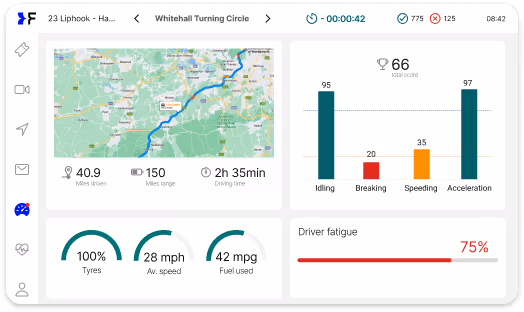
Telematics

Diagnostics

My account page

Validations counter (upper right corner)
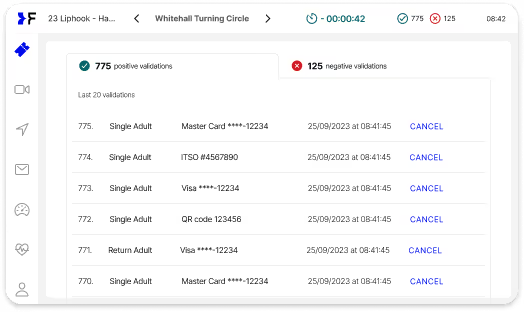
Positive ticket validations list
Project 5: Parking Terminal UX Enhancement
The Challenge:
Research revealed that terminal UI contrast was difficult in high-glare outdoor situations. The interface was also difficult to read for users in wheelchairs or facing other challenges preventing them from viewing the screen at eye level.
The Purpose:
Improve quality and convenience of on-street and off-street parking terminals.
User Benefit:
- For Drivers: Clear and easy parking experience regardless of lighting conditions or physical positioning.
- For Operators: Reliable experience ensuring great customer experience and reducing support needs.
Design Approach:
Simple, easy, and considerate of the environment where the UI is used and the variety of users and their circumstances. Improved contrast ratios for outdoor readability. Optimized text size and positioning for viewing from varying heights and angles.
Research revealed that terminal UI contrast was difficult in high-glare outdoor situations. The interface was also difficult to read for users in wheelchairs or facing other challenges preventing them from viewing the screen at eye level.
Improve quality and convenience of on-street and off-street parking terminals.
For Drivers: Clear and easy parking experience regardless of lighting conditions or physical positioning.
For Operators: Reliable experience ensuring great customer experience and reducing support needs.
Simple, easy, and considerate of the environment where the UI is used and the variety of users and their circumstances. Improved contrast ratios for outdoor readability. Optimized text size and positioning for viewing from varying heights and angles.
Testing & Iteration Example
Discovery - In field research:
The designer conducted a series of in-person interviews in France with those who were willing to give feedback on their parking experience. This feedback was organized into a document to start making discoveries for what was working and what could be improved.
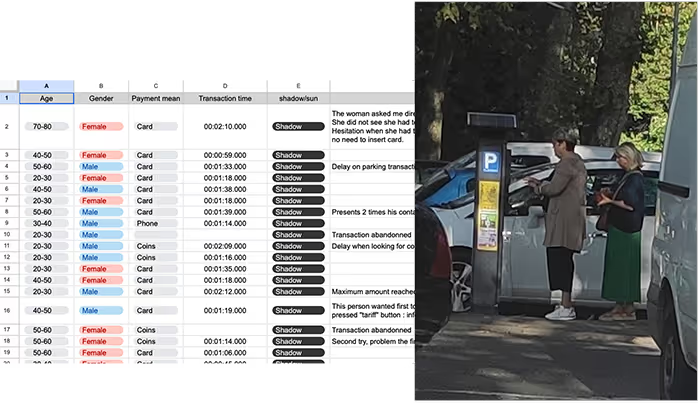
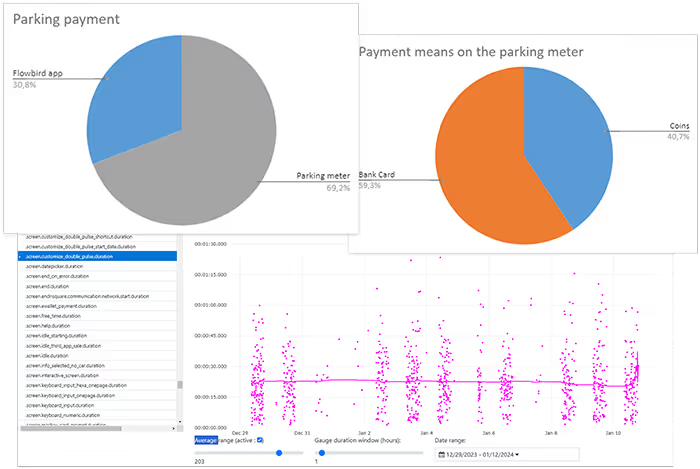
Discovery - Metrics:
Metrics were pulled on recent parks for 76,274 parking transactions. Clearly the parking meter was an important experience since almost 3/4ths of the parks in the region happened using terminal meters. Additionally, it was clear that the sessions (initial tap to finish) took too long.
Existing screens and accessibility:
Feedback from and observations of users made it clear that there were usability issues. Glare, a cluttered UI, and accessibility issues indicated areas for improvement.

Personas and user journeys:
To understand users better and document for the team, personas and user journeys were created using our in-field interviews and metrics.

Selected final designs:
The UI was updated to a ligher background to address the screen glare issues. The UI was made more friendly, minimized as much as legally possible, and organized to be more accessible.
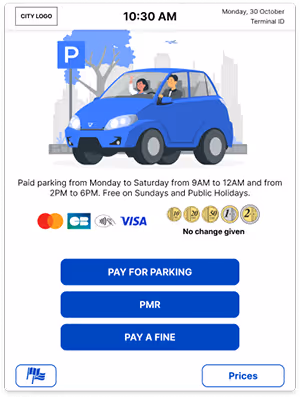
Get started

Enter car plate number - Safe accessibility zone
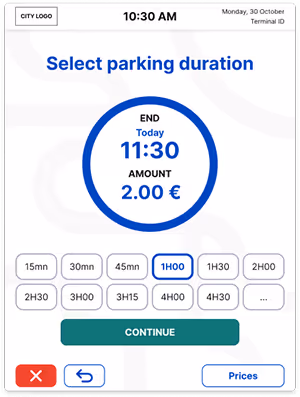
Parking duration

Payment method

Parking ticket

Finish
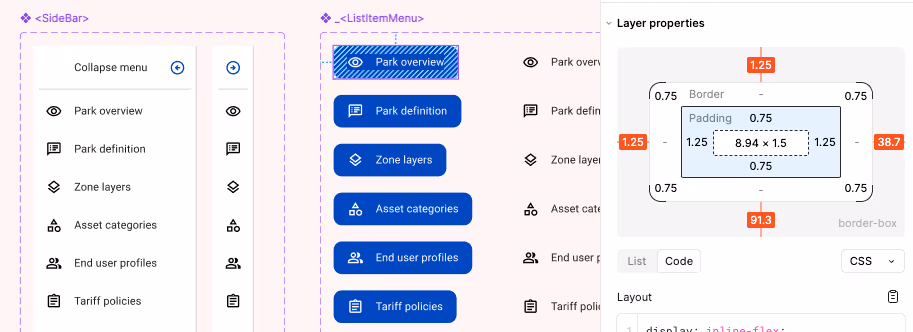
Design Systems:
The Infrastructure for Scale
One of the most significant contributions to Flowbird's product maturity was establishing comprehensive design systems—the infrastructure enabling consistency, speed, and quality across a massive international portfolio.
What We Built

Platform-Specific Component Libraries:
SaaS (Web): Data visualization components, dashboard layouts, form patterns, navigation systems, modal patterns
Mobile (Core & White Label): Transaction flows, wallet patterns, map integrations, payment components, onboarding sequences, settings architecture
Terminals: Physical interface patterns, high-contrast components, accessibility-focused interactions
Public Transport: Driver-focused UI components, alert systems, ticketing interfaces

Documentation Approach:
Confluence: Lengthy details and standard operating procedures (SOPs)
Figma: Component documentation, usage guidelines, and pattern libraries
Jira: Integration with development workflow for component requests and updates

Established Patterns:
Mobile onboarding flows, wallet management, settings architecture, data visualizations, AI interface patterns, and more—all documented and reusable across projects.
The Impact of Design Systems
The design systems weren't just about visual consistency—they fundamentally changed how the team worked:

Speed: Designers could assemble new screens from proven components rather than starting from scratch

Quality: Every component was tested and refined, raising baseline quality across all projects

Scalability: White label apps could be customized quickly because the underlying system was solid

Onboarding: New team members could become productive faster with clear patterns to follow

Cross-platform Consistency: Users experienced coherent Flowbird experiences whether on mobile, web, or physical terminals
Accessibility & Compliance
WCAG Compliance Standards
Given Flowbird's presence in 6,000+ cities across 80+ countries, accessibility and regulatory compliance weren't optional—they were foundational requirements.
We ensured all products met accessibility requirements:
- No pre-checked consent boxes
- Collected only essential data during onboarding
- Easy and transparent settings management
- Every page had clear, visible focus states
- Page titles were unique and descriptive
- Landmarks/regions used correctly (header, main, nav, footer)
- Landmarks/regions used correctly (header, main, nav, footer)
- Links described destinations ("View report" not "Click here")
- Search, menus, filters, and navigation were consistent across experiences
- High color contrast ratios for outdoor terminal use
- Text sizing and positioning optimized for various viewing angles and heights
GDPR & Data Privacy
Operating across European markets required rigorous GDPR compliance, particularly around user consent, data collection, and transparent settings management. Our design approach made privacy controls accessible and understandable, not buried in legal text.
Implementation & Collaboration:
Building Strategic Partnerships
Transforming UX from production service to strategic partner required fundamentally changing how we collaborated across functions.
Engineering Partnership
Our Approach:
Engineering joined bi-weekly scrums for shared visibility. Mid-sprint check-ins enabled feasibility discussions. UX followed up post-handoff to ensure reviews before release. Developers participated in ideation for early input.
Quality Assurance in Handoff:
I set Figma standards—auto-layout, clear annotations, and prototypes for major projects. We trained developers on Dev Mode and aligned on optimal workflows. Designers held handoff meetings and followed up to review progress.
Why This Mattered:
The "black box" problem disappeared. Developers understood design intent, designers understood technical constraints, and collaboration became proactive rather than reactive.
Product Management Partnership
Why This Relationship Was Critical:
The PM–UX partnership was central to my DesignOps. PMs joined all scrum ceremonies, and we worked together to shape the backlog and prioritize projects.
PMs as Connectors:
PMs helped us access internal user data, connect with in-house Hub users, and reach the right people across the global organization to inform better design decisions.
Shared Ownership:
This partnership meant PMs and designers jointly owned outcomes, not just outputs. We weren't designing what PMs specified—we were partnering to solve user problems.
My Leadership Approach:
Building a High-Performing Team
Team Structure & Hiring Philosophy
I hired strategically, assigning designers to specific platform verticals (mobile, SaaS, terminals, public transport). This created clear ownership, allowed designers to develop deep expertise, and ensured someone was always thinking about each product's unique needs.
Who you hire is crucial. I learned to take real consideration during the hiring process, looking not just for design skills but for:
- Ability to work independently across time zones
- Communication clarity, especially when English wasn't first language
- Cultural fit with collaborative, user-centered approach
- Intellectual curiosity and desire to learn
Beyond process and products, the most significant transformation was building a team that could sustain excellence.

Daily Operations & Team Culture
Regular Rhythms:
- Daily check-ins for alignment and support
- Bi-weekly design reviews for quality and learning
- Monthly education lectures for skill development
- Quarterly team retrospectives and planning sessions
- Implementation of "double-diamond" design methodology
Creating Learning Culture:
I included team members in high-level conversations—research synthesis, strategy sessions, stakeholder meetings—so they understood the "why" behind decisions and grew their strategic thinking, not just execution skills.

Distributed Team Management
Managing designers across France, Poland, Switzerland, India, UK, and USA taught me critical lessons:

Clear, Specific Communication:
Working across time zones requires crystal-clear communication. When team members use English as a second language, I learned to use simple vocabulary, avoid idioms, and ask follow-up questions to ensure understanding.
Explicit Expectations:
I established clear expectations for video call conduct: no vaping, show your face (unless justifiable reason), dress professionally. These standards maintained professionalism and team cohesion despite physical distance.
Labor Law Awareness:
Understanding labor laws in different countries proved crucial. I learned to be prepared to find workarounds in hiring, whether it be contracting or understanding the "probation" periods of some countries to evaluate performance.
Navigating the Merger
Taking a team through the Flowbird-EasyPark merger (becoming Arrive) was a difficult and emotional process. Unfortunately, mergers are times when companies are very decisive about budget and performance issues.
My Approach:
I found that transparency was essential. Some people would inevitably be let go, and team members (especially contractors) needed to be prepared for this reality. I kept morale and productivity up by being factual, honest, and avoiding ambiguity as much as possible.
The Result:
We maintained 95% team retention through the merger—an exceptional outcome that reflected the trust we'd built and the value the team demonstrably delivered.
Outcomes, Impact, and Reflections

Quantitative Results
Product Portfolio:
- Redesigned/designed new features for SaaS Hub dashboard for urban mobility management
- Launched 10+ white label mobile apps (Detroit achieved 4.6/5 app store rating)
- Enhanced core Flowbird app with EV charging, CarPlay, app clips, widgets, live activity
- Redesigned public transport console for UK bus drivers
- Improved parking terminal accessibility and outdoor readability
- Delivered features across all platforms: AI reporting UI, business overview dashboard, tariff simulators, EV management, pay-as-you-go integration, and more
Team Transformation (2.7 years):
- Employee retention improved from ~50% to 95%
- Time-to-market accelerated by 25%
- Team productivity/output increased by 45%
Qualitative Impact
Stakeholder Testimonials:
"The expertise and leadership from A Stronger Idea Design have been instrumental in transforming how we approach UX at Flowbird. Their impact has gone beyond design—it has positively influenced our entire product development lifecycle."

Marek Juda, Digital Chief Operating Officer, Flowbird
"Eric has been an exceptional leader and collaborator during our time working together. When Eric joined us, we needed to structure our UX team and integrate design into our product development process. He rose to this challenge by creating a sustainable framework that positioned UX as a core pillar of our product strategy."

Darek Partyka, Chief Product Officer, Flowbird
"Eric is an exceptional Product Designer, focused on usability and solving real business problems. Under his direction, the team developed UI/UX processes grounded in predictability, transparency, and a deep understanding of user challenges. He not only led the design organization but also validated team output and set clear guidelines. Whenever support was needed, Eric stepped in—whether to guide UX research in unfamiliar areas or to create foundational UI concepts that the team could evolve into a full design system."

Sebastian Wilk, Digital Solutions Architect
Organizational Impact
UX as Strategic Partner:
Transformed UX from an afterthought production service to a core pillar of product strategy. Design was now at the table for strategic discussions, not just receiving specifications to execute.
Scalable Operations:
Implemented design operations that scaled across 5 platform verticals, 8 team members, and 80+ countries. The processes, documentation, and design systems created sustainable infrastructure for continued growth.
Cultural Change:
Changed how the entire organization thought about user-centered design. Product managers, developers, and business stakeholders now understood UX value and actively sought design partnership early in initiatives.
Reflection & What I Learned
What Worked Well
1. The Team I Built
I'm immensely proud of the distributed team we assembled across France, Poland, Switzerland, India, UK, and USA. Despite geographic and cultural differences, we built a cohesive, high-performing unit that delivered world-class design work.
2. The Process and Operations
Implementing structured DesignOps—scrum/sprint methodology, regular research cadences, managed backlog, clear documentation standards—transformed chaos into predictability. The 45% productivity increase and 25% faster time-to-market weren't accidents—they were the direct result of intentional operational design.
3. The Design Systems
Building, implementing, and managing comprehensive design systems for web, mobile, and physical terminals was foundational to our success. These systems enabled consistency across 6,000+ cities, accelerated white label app development, and raised baseline quality across the entire portfolio.
4. The Product Transformations
The improvement to overall UX quality and the new initiatives we completed—white label projects, SaaS Hub redesign, UK bus driver transport UX—demonstrated what's possible when design is properly resourced, supported, and integrated into product development.
What I'd Do Differently & Key Learnings
Distributed Team Communication: Hire for independent work, cross-cultural clarity, and remote adaptability. Clear, specific communication across time zones is essential.
Labor Law Navigation: Understand local labor laws to plan hiring and team management. In restrictive regions, consider reassignment, coaching, or restructuring instead of termination.
Cross-Cultural Communication: Use simple, clear language for non-native English speakers. Avoid idioms and complex sentences; confirm understanding with follow-ups.
Video Call Standards: Set early expectations for professionalism: show your face, dress appropriately, and follow conduct rules. Small details shape team culture and engagement.
Global Product Considerations: Design globally from the start. Account for culture, language, color, messaging, and localization—these are foundational, not afterthoughts.
Advocating for User-Centered Design: Connect user insights to business outcomes to make research non-negotiable. Show how understanding users reduces waste, accelerates adoption, and improves satisfaction.
Merger Navigation & Transparency: Be factual and transparent during mergers. Prepare the team for changes, maintain morale, and avoid ambiguity. Honesty preserves trust—our 95% retention rate proved it.
Evolution & Legacy
Where the Products Are Now
Flowbird merged with EasyPark and became Arrive (arrive.com), creating one of the world's largest parking and mobility platforms. The design systems, operational processes, and product improvements we implemented became part of the foundation for this larger entity.
How My Work Evolved
Distributed Team Management: Led designers across six countries, mastering asynchronous communication, cross-cultural collaboration, and remote mentorship.
Strategic Operations: Built scalable design processes, managed multi-product backlogs, and demonstrated ROI through metrics.
Business Acumen: Collaborated with leadership, presented updates, and navigated a merger, aligning design decisions with revenue, market positioning, and operational strategy.
Change Management: Rebuilt teams, transformed processes, and shifted culture, learning that design leadership is as much about people, process, and politics as it is about pixels.
Key Takeaways for Design Leaders
If you're tasked with transforming UX maturity in an organization, here's what I learned:
1. Diagnosis Before Prescription
Don't assume you know the problems. Conduct thorough audits through stakeholder interviews, design reviews, and process analysis. Establish baselines for metrics you intend to improve. The credibility you build through thoughtful diagnosis creates permission for difficult decisions later.
2. Quick Wins Build Momentum
While planning long-term transformation, deliver quick wins that demonstrate immediate value. Faster turnaround, clearer communication, and visible improvements build credibility for larger systemic changes. Stakeholders need to see progress, not just hear about strategy.
3. Team Quality Trumps Team Size
Sometimes the hardest decision is acknowledging that the existing team isn't equipped for the mission ahead. Strategic hiring aligned to specific needs (platform verticals, in our case) is more effective than trying to upskill everyone. This is difficult but necessary for transformation.
4. Process Enables Creativity
Structured DesignOps—scrum/sprint methodology, managed backlogs, regular reviews, clear documentation—doesn't stifle creativity. It creates the predictability and psychological safety that allows creativity to flourish. Chaos doesn't breed innovation; it breeds anxiety.
5. Design Systems Are Strategic Infrastructure
Treat design systems as foundational infrastructure, not nice-to-have polish. They enable consistency, accelerate development, improve quality, and allow teams to scale. The investment pays dividends across every subsequent project.
6. Speak the Language of Business
Design leaders must translate design value into business outcomes. Learn to discuss revenue impact, operational efficiency, market positioning, and competitive advantage—not just usability and aesthetics. This fluency earns you a seat at the strategic table.
7. Distributed Teams Require Intentional Culture
Geographic distribution doesn't prevent cohesion, but it requires intentional effort. Clear communication standards, regular rhythms, explicit expectations, and inclusive practices must be deliberately designed, not assumed.
8. Transparency During Uncertainty
Whether navigating team restructuring or organizational mergers, transparency builds trust even when delivering difficult news. People respect honesty about uncertainty more than false reassurance. The 95% retention rate through our merger validated this approach.
9. User Research Is Non-Negotiable
Making user research and testing foundational—not optional—transforms how organizations make decisions. When stakeholders see design decisions backed by user insights and measurable outcomes, UX becomes strategic partner, not production service.
10. Change Takes Time and Patience
Transforming UX maturity took nearly three years of consistent effort across four distinct phases. Quick fixes don't exist for systemic problems. Sustainable change requires patience, persistence, and the willingness to play the long game.
Closing Thoughts
When I joined Flowbird, UX was disconnected, under-resourced, and undervalued. Nearly three years later, we transformed it into a high-performing design organization central to product strategy.
The change wasn’t just processes or interfaces—it was culture. Product managers sought UX early, developers collaborated on design intent, and leadership highlighted design quality as a competitive advantage. Investing in research and design became essential, not optional.
I’m proud of the teams, systems, products, and operational excellence we built. Flowbird taught me that design leadership blends craft with team-building, operations, culture, and business impact. Pixels and processes, creativity and strategy, empathy and metrics—combined, they create transformational value.
My approach: pair strategic vision with operational excellence, user empathy with business insight, and lead design organizations that don’t just make better products—they make better companies.
FAQ
Eric Tomlinson served as Head of Design at Flowbird, where he transformed the UX function from a reactive production team into a strategic design partner, leading cross-functional teams and establishing design operations that drove measurable improvements in productivity and time-to-market.
The existing UX team was seen as a production service with little strategic influence, inconsistent design practices, no unified design system, and no clear process for user research or collaboration, which limited product quality and team efficiency.
By implementing structured design operations, standards, research practices, and scalable design systems, the team increased productivity by approximately 45%, accelerated time-to-market by about 25%, and achieved 95% retention during a complex merger.
The transformation enabled improved SaaS dashboards, multiple white-label mobile applications, accessibility improvements, enhanced terminals, and stronger design consistency across products serving cities and operators in over 6,000 locations worldwide.
By positioning UX as a strategic partner rather than a service arm, Eric’s leadership helped Flowbird improve delivery quality, align design with business goals, and navigate organizational change during an international merger—boosting design influence and product maturity.
The approach combined stakeholder interviews, design operations implementation, scalable design systems, process standardization, user research practices, and iterative testing to build a predictable, transparent, and strategic design function.
You can reach out directly using the links in the footer below, or head back to the Projects page to see more of my work.
Selected work
Flowbird: UX Maturity
Estate Guru: Modernizing Estate Planning
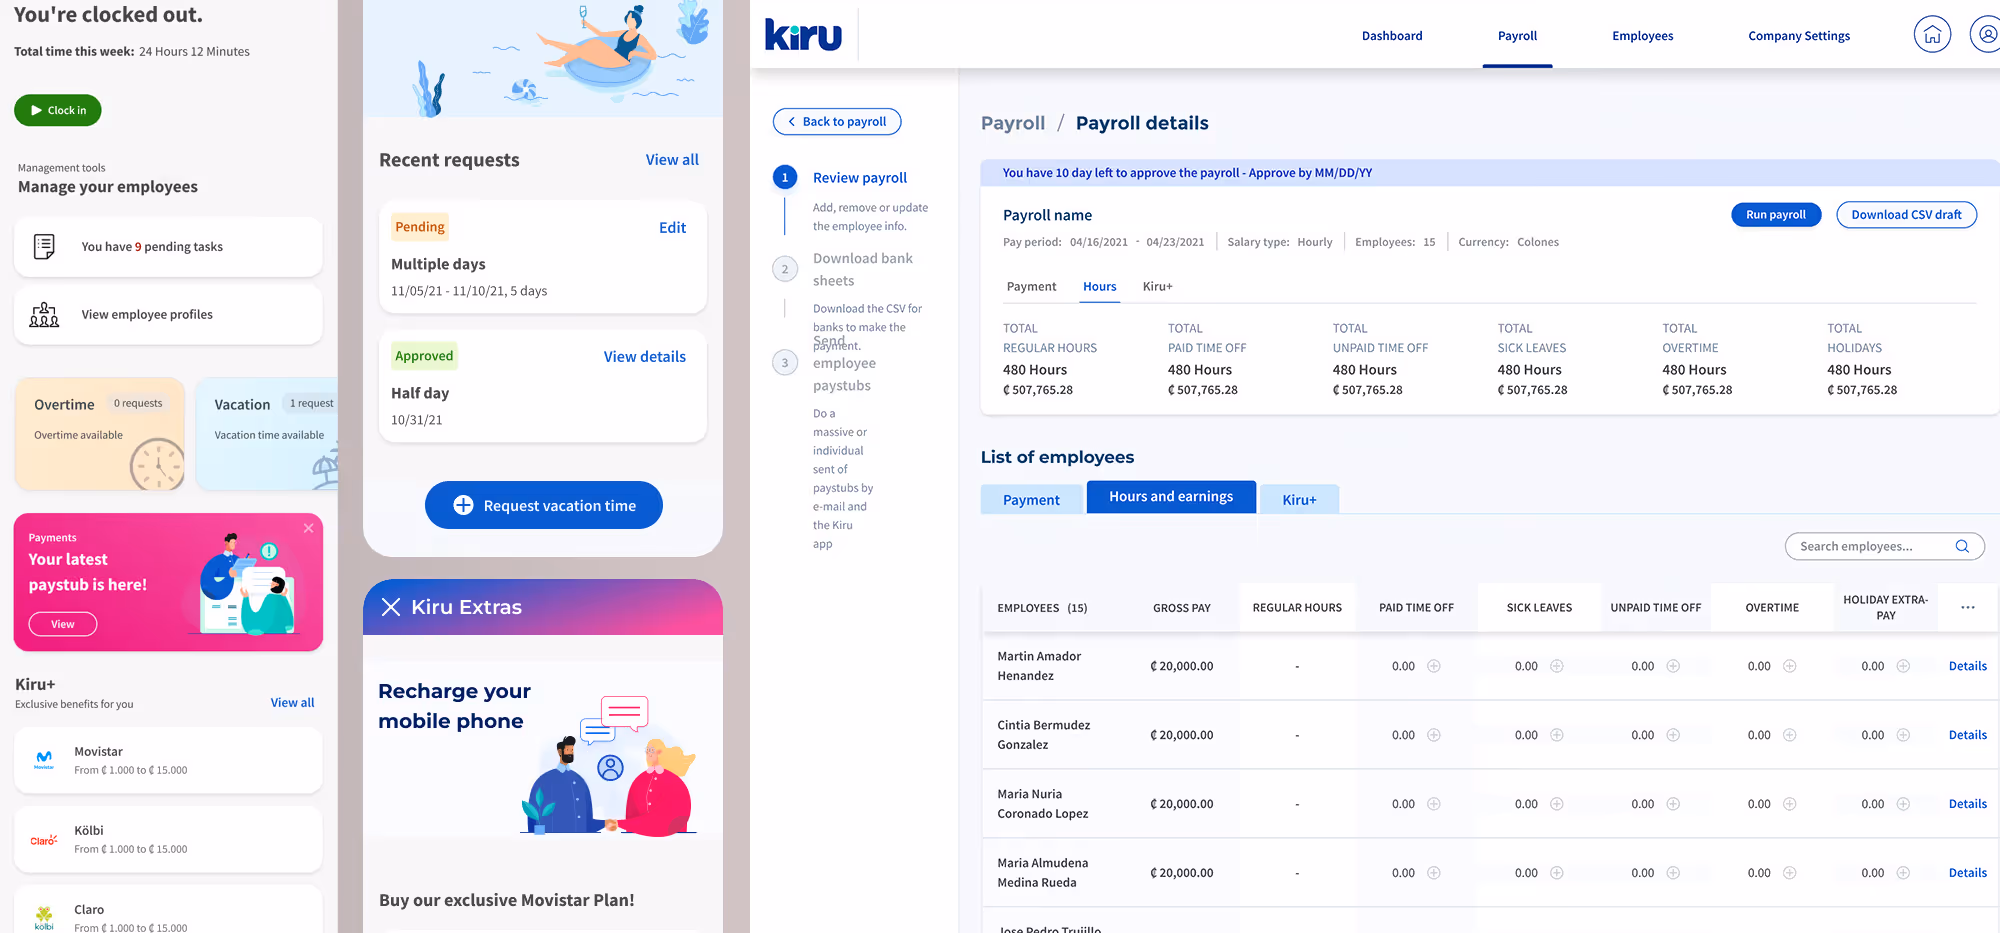
Kiru: A Payroll Startup

PayPal: Unified Card System
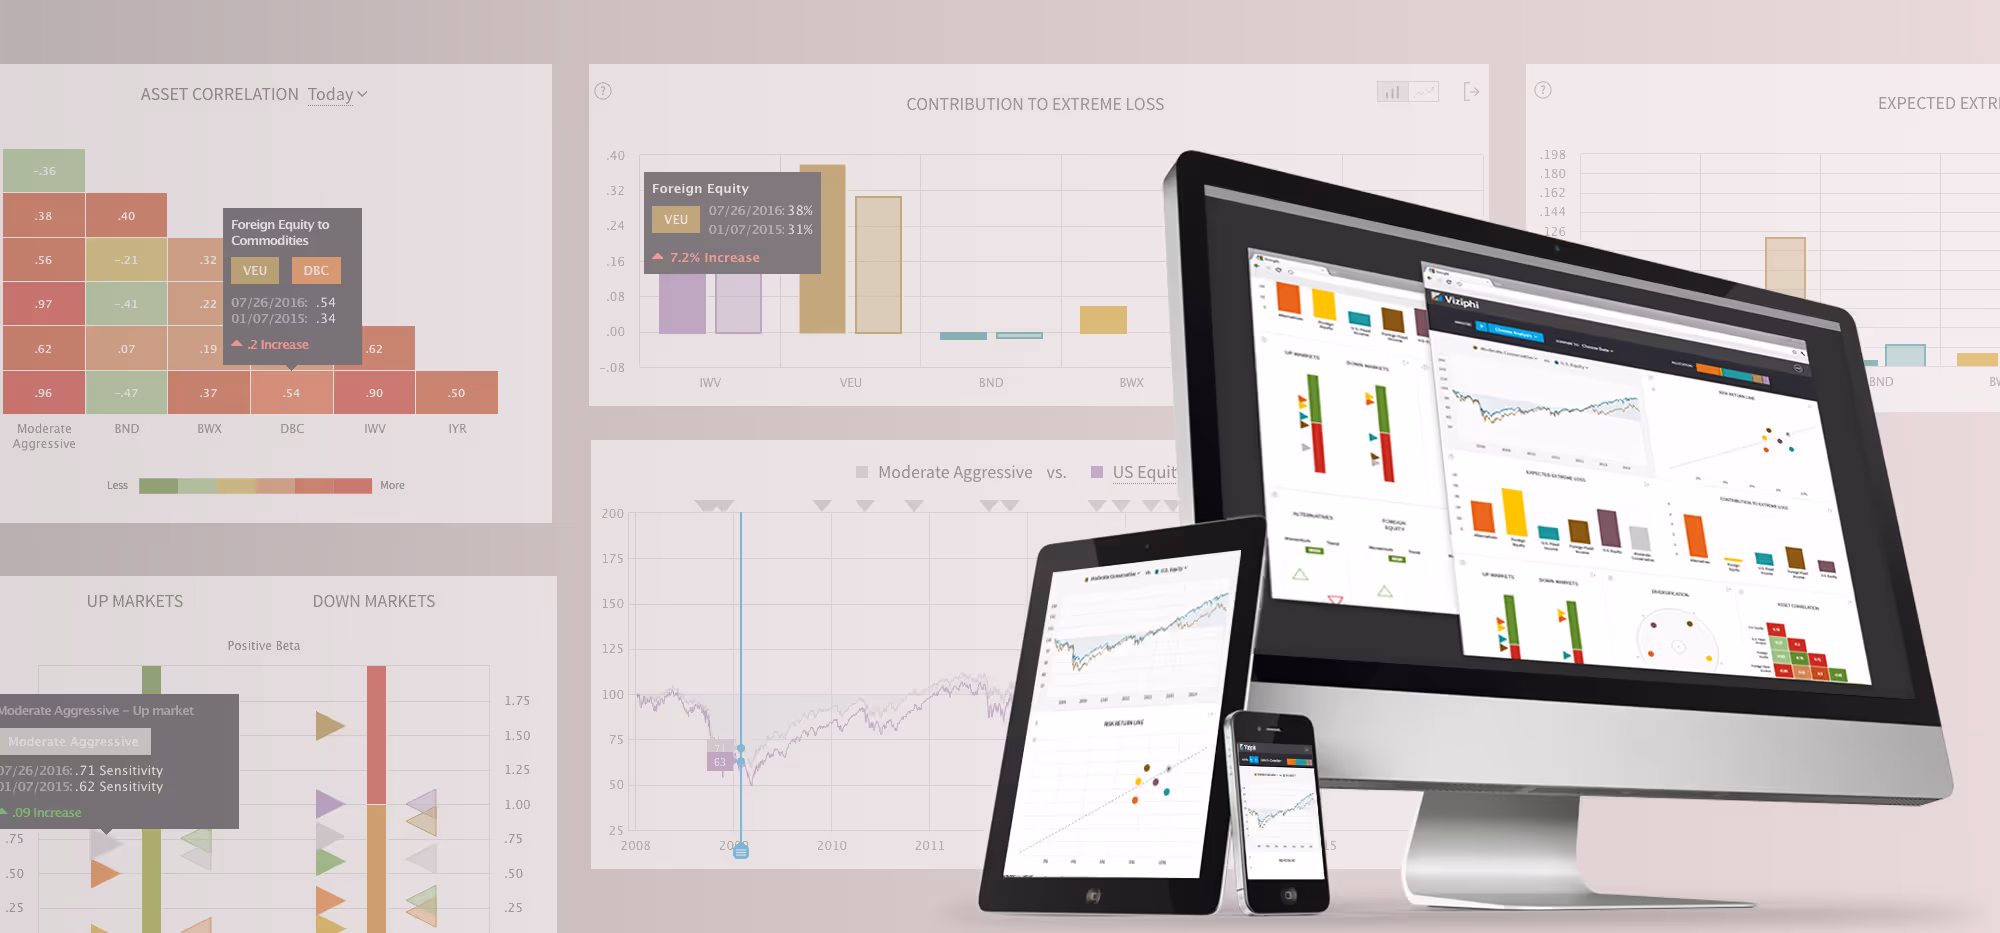
Viziphi: Visualizing Wealth
PayPal: Settings Redesign